Misc
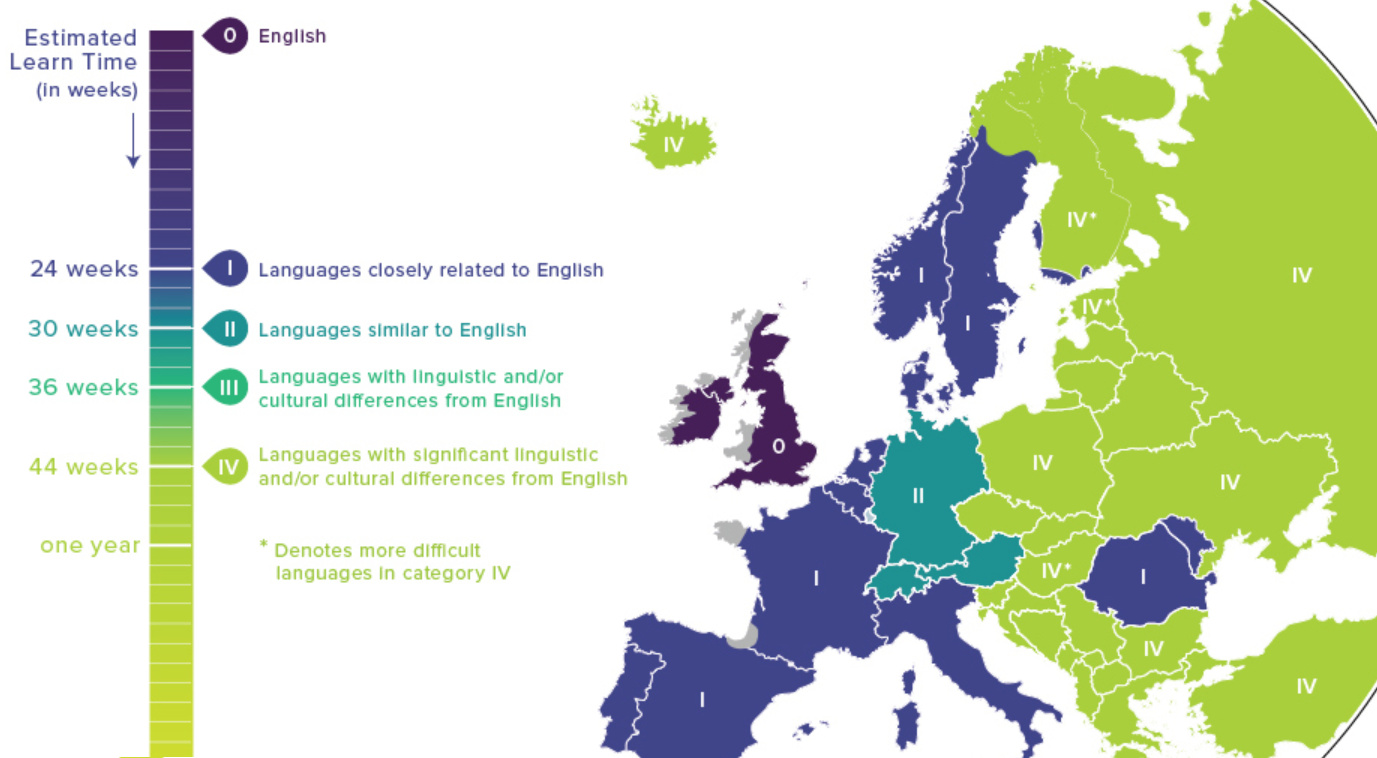
Map: Language Difficulty Ranking For English Speakers
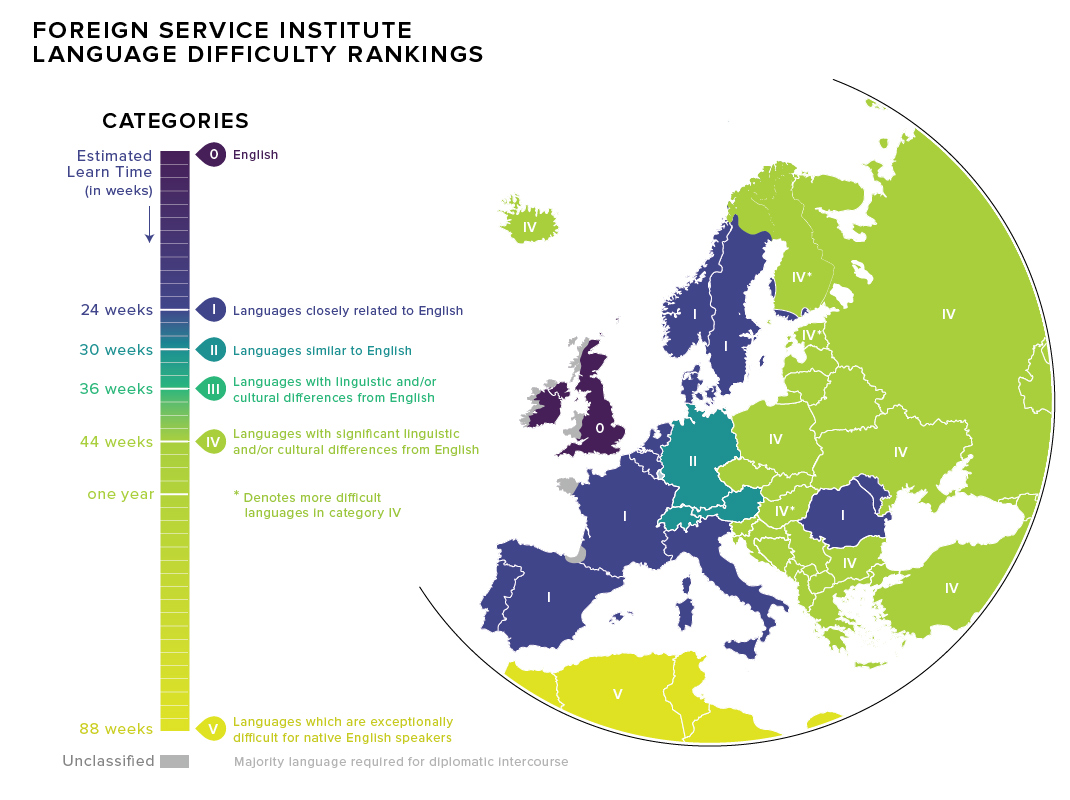
Language Difficulty Ranking For English Speakers
Learning a new language as an adult is big undertaking – so if you want the best value for your time, choose wisely.
For most people, there are no time constraints on becoming fluent in another language, but for the Foreign Service Institute – the U.S. government’s main provider of foreign affairs training – quantifying the “learn time” of various languages is vital. American diplomats, for example, need to become proficient in the official language of their posting country, and it helps immensely to know how long that might take.
The FSI organizes languages into five broad categories based on how different each language and culture is to the United States:
Category I: The Quick Ones
Category I languages are the easiest for English speakers, who can reach reading and speaking proficiency within about half a year of intense study. There is a mix Romance and Germanic languages in this classification, including Dutch, Swedish, French, Spanish, and Italian.
It might be surprising also to learn that Afrikaans is in this “easiest” category as well. It uses 26 letters in its alphabet like English (although it also contains additional phonetic sounds), and has a lot in common with modern Dutch.
Category II: Es ist schwer zu sagen
Though German is very closely related to English, there are grammar quirks that bump it up in difficulty. FSI estimates it would take 30 weeks of intense study to become proficient in German.
Category III: Intermediate
Category III languages are mainly spoken in Southeast Asia, and they include Indonesian and Malay. Swahili also counts as a Category III language. (Note: there are no Category III languages spoken in Europe.)
Category IV: For people who like a challenge
Category IV includes the most challenging European languages for English speakers to pick up. Here you’ll find Slavic and Baltic languages such as Polish, Croatian, and Latvian, as well as Greek, Turkish, and Icelandic.
This category also includes Finnish, Estonian and Hungarian. These Uralic languages have the distinction of being particularly challenging for English speakers to master as they have little in common with any other European languages. FSI estimates it would take a year of intense study to become proficient in these languages.
Category V: For people who really like a challenge
Languages in category V are the most challenging for English speakers because they generally have completely unfamiliar scripts and cultural assumptions. These languages are most common in Asia and the Middle East.
While Mandarin, Arabic, and Korean are sufficiently difficult to comprehend, Japanese has a reputation for being the toughest in this group thanks, in part, to multiple writing styles.
Mastering Japanese could take years, but FSI estimates that it’ll be at least 88 weeks before you’re chatting your way through Tokyo.
べんきょうがんばってください。
This map was inspired by one created by Redditor, Fummy.


Misc
How Hard Is It to Get Into an Ivy League School?
We detail the admission rates and average annual cost for Ivy League schools, as well as the median SAT scores required to be accepted.


How Hard Is It to Get Into an Ivy League School?
This was originally posted on our Voronoi app. Download the app for free on iOS or Android and discover incredible data-driven charts from a variety of trusted sources.
Ivy League institutions are renowned worldwide for their academic excellence and long-standing traditions. But how hard is it to get into one of the top universities in the U.S.?
In this graphic, we detail the admission rates and average annual cost for Ivy League schools, as well as the median SAT scores required to be accepted. The data comes from the National Center for Education Statistics and was compiled by 24/7 Wall St.
Note that “average annual cost” represents the net price a student pays after subtracting the average value of grants and/or scholarships received.
Harvard is the Most Selective
The SAT is a standardized test commonly used for college admissions in the United States. It’s taken by high school juniors and seniors to assess their readiness for college-level academic work.
When comparing SAT scores, Harvard and Dartmouth are among the most challenging universities to gain admission to. The median SAT scores for their students are 760 for reading and writing and 790 for math. Still, Harvard has half the admission rate (3.2%) compared to Dartmouth (6.4%).
| School | Admission rate (%) | SAT Score: Reading & Writing | SAT Score: Math | Avg Annual Cost* |
|---|---|---|---|---|
| Harvard University | 3.2 | 760 | 790 | $13,259 |
| Columbia University | 3.9 | 750 | 780 | $12,836 |
| Yale University | 4.6 | 760 | 780 | $16,341 |
| Brown University | 5.1 | 760 | 780 | $26,308 |
| Princeton University | 5.7 | 760 | 780 | $11,080 |
| Dartmouth College | 6.4 | 760 | 790 | $33,023 |
| University of Pennsylvania | 6.5 | 750 | 790 | $14,851 |
| Cornell University | 7.5 | 750 | 780 | $29,011 |
*Costs after receiving federal financial aid.
Additionally, Dartmouth has the highest average annual cost at $33,000. Princeton has the lowest at $11,100.
While student debt has surged in the United States in recent years, hitting $1.73 trillion in 2023, the worth of obtaining a degree from any of the schools listed surpasses mere academics. This is evidenced by the substantial incomes earned by former students.
Harvard grads, for example, have the highest average starting salary in the country, at $91,700.

-

 Real Estate2 weeks ago
Visualizing America’s Shortage of Affordable Homes
-

 Technology1 week ago
Ranked: Semiconductor Companies by Industry Revenue Share
-

 Money1 week ago
Which States Have the Highest Minimum Wage in America?
-

 Real Estate1 week ago
Ranked: The Most Valuable Housing Markets in America
-

 Business1 week ago
Charted: Big Four Market Share by S&P 500 Audits
-

 AI1 week ago
The Stock Performance of U.S. Chipmakers So Far in 2024
-

 Misc2 weeks ago
Almost Every EV Stock is Down After Q1 2024
-

 Money2 weeks ago
Where Does One U.S. Tax Dollar Go?