Markets
Visualizing a Global Shift in Wealth Over 10 Years
Visualizing a Global Shift in Wealth Over 10 years
The Chart of the Week is a weekly Visual Capitalist feature on Fridays.
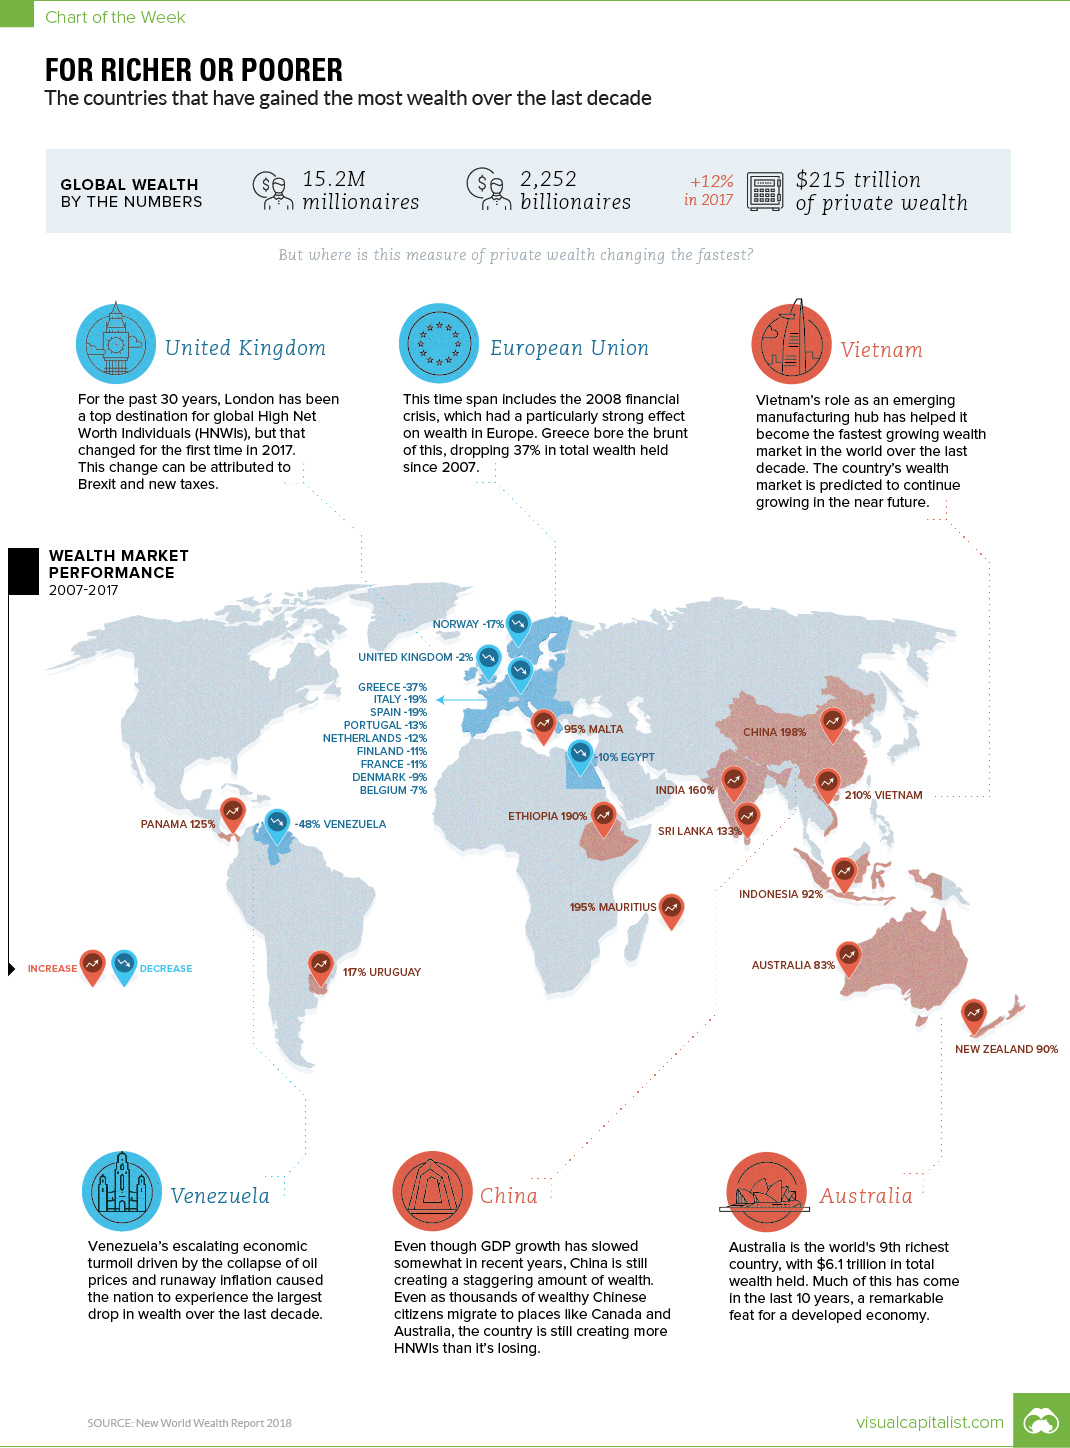
The world has now accumulated $215 trillion in private wealth, a 12% increase over 2017, according to the latest report by market research company New World Wealth.
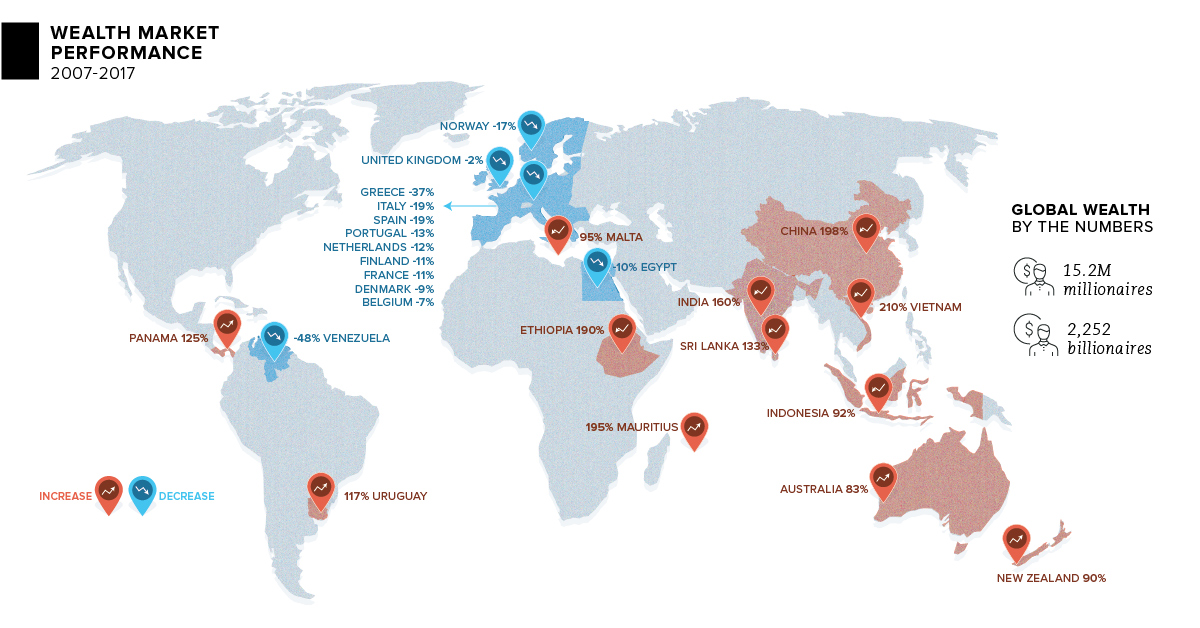
This number today includes wealth held by the general population, as well as the 15.2M millionaires ($1M+ in assets), 584,000 multi-millionaires ($10M+ in assets), and 2,252 billionaires ($1B+ in assets) in the world.
But the picture of global wealth hasn’t always been constant – in fact, it’s always shifting based on market performance, the movement of high net worth individuals (HNWIs), demographic trends, and other factors.
Top Countries Adding Wealth
Over the last decade, from 2007 to 2017, here are the top countries based on percentage of new wealth added (in $USD terms):
| Rank | Country | Wealth Growth (2007-2017) |
|---|---|---|
| #1 | Vietnam | 210% |
| #2 | China | 198% |
| #3 | Mauritius | 195% |
| #4 | Ethiopia | 190% |
| #5 | India | 160% |
| #6 | Sri Lanka | 133% |
| #7 | Panama | 125% |
| #8 | Uruguay | 117% |
| #9 | Malta | 95% |
| #10 | Indonesia | 92% |
Not surprisingly, plenty of developing markets made this list.
Vietnam, which had a 210% growth in wealth held over the last decade, is an emerging manufacturing hub. The market is projected by New World Wealth to grow a further 200% in the next 10 years, bolstered by strong growth in its local healthcare, manufacturing, and financial services sectors.
The small island nation of Mauritius is one of Africa’s brightest success stories, with a 195% growth in wealth over the last 10 years. With favorable tax policies, beautiful beaches, and better relative safety ratings, HNWIs have been moving to the island en masse.
Just missing the Top 10 list above are two developed economies: New Zealand and Australia. Interestingly, these two markets grew in wealth 90% and 83% respectively over the last decade, which is extremely impressive for countries that already had a solid base of wealth to start with.
Countries That Lost Wealth
Here are the markets that saw total wealth decrease over the last 10 years, in terms of U.S. dollars.
| Rank | Country | Wealth Growth (2007-2017) |
|---|---|---|
| #1 | Venezuela | -48% |
| #2 | Greece | -37% |
| #3 | Italy | -19% |
| #4 | Spain | -19% |
| #5 | Norway | -17% |
| #6 | Portugal | -13% |
| #7 | Netherlands | -12% |
| #8 | France | -11% |
| #9 | Finland | -11% |
| #10 | Egypt | -10% |
The crisis in Venezuela had a particularly rough impact on wealth. The country, which was once the richest in South America, lost 48% of its wealth in $USD terms over the last decade.
It’s also worth mentioning that many of the countries that saw wealth decrease over this time period are European – that’s because the 2008 financial crisis (and the ensuing sovereign debt crisis) hit Europe particularly hard.
Greece bore the brunt of this impact, losing 37% of its wealth in the 2007-2017 period.


Markets
The European Stock Market: Attractive Valuations Offer Opportunities
On average, the European stock market has valuations that are nearly 50% lower than U.S. valuations. But how can you access the market?


European Stock Market: Attractive Valuations Offer Opportunities
Europe is known for some established brands, from L’Oréal to Louis Vuitton. However, the European stock market offers additional opportunities that may be lesser known.
The above infographic, sponsored by STOXX, outlines why investors may want to consider European stocks.
Attractive Valuations
Compared to most North American and Asian markets, European stocks offer lower or comparable valuations.
| Index | Price-to-Earnings Ratio | Price-to-Book Ratio |
|---|---|---|
| EURO STOXX 50 | 14.9 | 2.2 |
| STOXX Europe 600 | 14.4 | 2 |
| U.S. | 25.9 | 4.7 |
| Canada | 16.1 | 1.8 |
| Japan | 15.4 | 1.6 |
| Asia Pacific ex. China | 17.1 | 1.8 |
Data as of February 29, 2024. See graphic for full index names. Ratios based on trailing 12 month financials. The price to earnings ratio excludes companies with negative earnings.
On average, European valuations are nearly 50% lower than U.S. valuations, potentially offering an affordable entry point for investors.
Research also shows that lower price ratios have historically led to higher long-term returns.
Market Movements Not Closely Connected
Over the last decade, the European stock market had low-to-moderate correlation with North American and Asian equities.
The below chart shows correlations from February 2014 to February 2024. A value closer to zero indicates low correlation, while a value of one would indicate that two regions are moving in perfect unison.
| EURO STOXX 50 | STOXX EUROPE 600 | U.S. | Canada | Japan | Asia Pacific ex. China |
|
|---|---|---|---|---|---|---|
| EURO STOXX 50 | 1.00 | 0.97 | 0.55 | 0.67 | 0.24 | 0.43 |
| STOXX EUROPE 600 | 1.00 | 0.56 | 0.71 | 0.28 | 0.48 | |
| U.S. | 1.00 | 0.73 | 0.12 | 0.25 | ||
| Canada | 1.00 | 0.22 | 0.40 | |||
| Japan | 1.00 | 0.88 | ||||
| Asia Pacific ex. China | 1.00 |
Data is based on daily USD returns.
European equities had relatively independent market movements from North American and Asian markets. One contributing factor could be the differing sector weights in each market. For instance, technology makes up a quarter of the U.S. market, but health care and industrials dominate the broader European market.
Ultimately, European equities can enhance portfolio diversification and have the potential to mitigate risk for investors.
Tracking the Market
For investors interested in European equities, STOXX offers a variety of flagship indices:
| Index | Description | Market Cap |
|---|---|---|
| STOXX Europe 600 | Pan-regional, broad market | €10.5T |
| STOXX Developed Europe | Pan-regional, broad-market | €9.9T |
| STOXX Europe 600 ESG-X | Pan-regional, broad market, sustainability focus | €9.7T |
| STOXX Europe 50 | Pan-regional, blue-chip | €5.1T |
| EURO STOXX 50 | Eurozone, blue-chip | €3.5T |
Data is as of February 29, 2024. Market cap is free float, which represents the shares that are readily available for public trading on stock exchanges.
The EURO STOXX 50 tracks the Eurozone’s biggest and most traded companies. It also underlies one of the world’s largest ranges of ETFs and mutual funds. As of November 2023, there were €27.3 billion in ETFs and €23.5B in mutual fund assets under management tracking the index.
“For the past 25 years, the EURO STOXX 50 has served as an accurate, reliable and tradable representation of the Eurozone equity market.”
— Axel Lomholt, General Manager at STOXX
Partnering with STOXX to Track the European Stock Market
Are you interested in European equities? STOXX can be a valuable partner:
- Comprehensive, liquid and investable ecosystem
- European heritage, global reach
- Highly sophisticated customization capabilities
- Open architecture approach to using data
- Close partnerships with clients
- Part of ISS STOXX and Deutsche Börse Group
With a full suite of indices, STOXX can help you benchmark against the European stock market.
Learn how STOXX’s European indices offer liquid and effective market access.

-

 Economy2 days ago
Economic Growth Forecasts for G7 and BRICS Countries in 2024
The IMF has released its economic growth forecasts for 2024. How do the G7 and BRICS countries compare?
-

 Markets1 week ago
U.S. Debt Interest Payments Reach $1 Trillion
U.S. debt interest payments have surged past the $1 trillion dollar mark, amid high interest rates and an ever-expanding debt burden.
-

 United States2 weeks ago
Ranked: The Largest U.S. Corporations by Number of Employees
We visualized the top U.S. companies by employees, revealing the massive scale of retailers like Walmart, Target, and Home Depot.
-

 Markets2 weeks ago
The Top 10 States by Real GDP Growth in 2023
This graphic shows the states with the highest real GDP growth rate in 2023, largely propelled by the oil and gas boom.
-

 Markets2 weeks ago
Ranked: The World’s Top Flight Routes, by Revenue
In this graphic, we show the highest earning flight routes globally as air travel continued to rebound in 2023.
-

 Markets2 weeks ago
Ranked: The Most Valuable Housing Markets in America
The U.S. residential real estate market is worth a staggering $47.5 trillion. Here are the most valuable housing markets in the country.


-

 Education1 week ago
How Hard Is It to Get Into an Ivy League School?
-

 Technology2 weeks ago
Ranked: Semiconductor Companies by Industry Revenue Share
-
Markets2 weeks ago
Ranked: The World’s Top Flight Routes, by Revenue
-

 Demographics2 weeks ago
Population Projections: The World’s 6 Largest Countries in 2075
-
Markets2 weeks ago
The Top 10 States by Real GDP Growth in 2023
-

 Demographics2 weeks ago
The Smallest Gender Wage Gaps in OECD Countries
-

 Economy2 weeks ago
Where U.S. Inflation Hit the Hardest in March 2024
-

 Green2 weeks ago
Top Countries By Forest Growth Since 2001