Misc
Visualizing the Average Flag of the World
Visualizing the Average Flag of the World
The intersection of data visualization and art is the perfect place to experiment.
In today’s graphic from Reddit user Udzu, flags serve as the visual raw material for experimentation. The visualization uses flags to show the “weight” of a country’s population or land area within its respective region – a unique thought exercise worth digging into.
Vexillology, Visualized
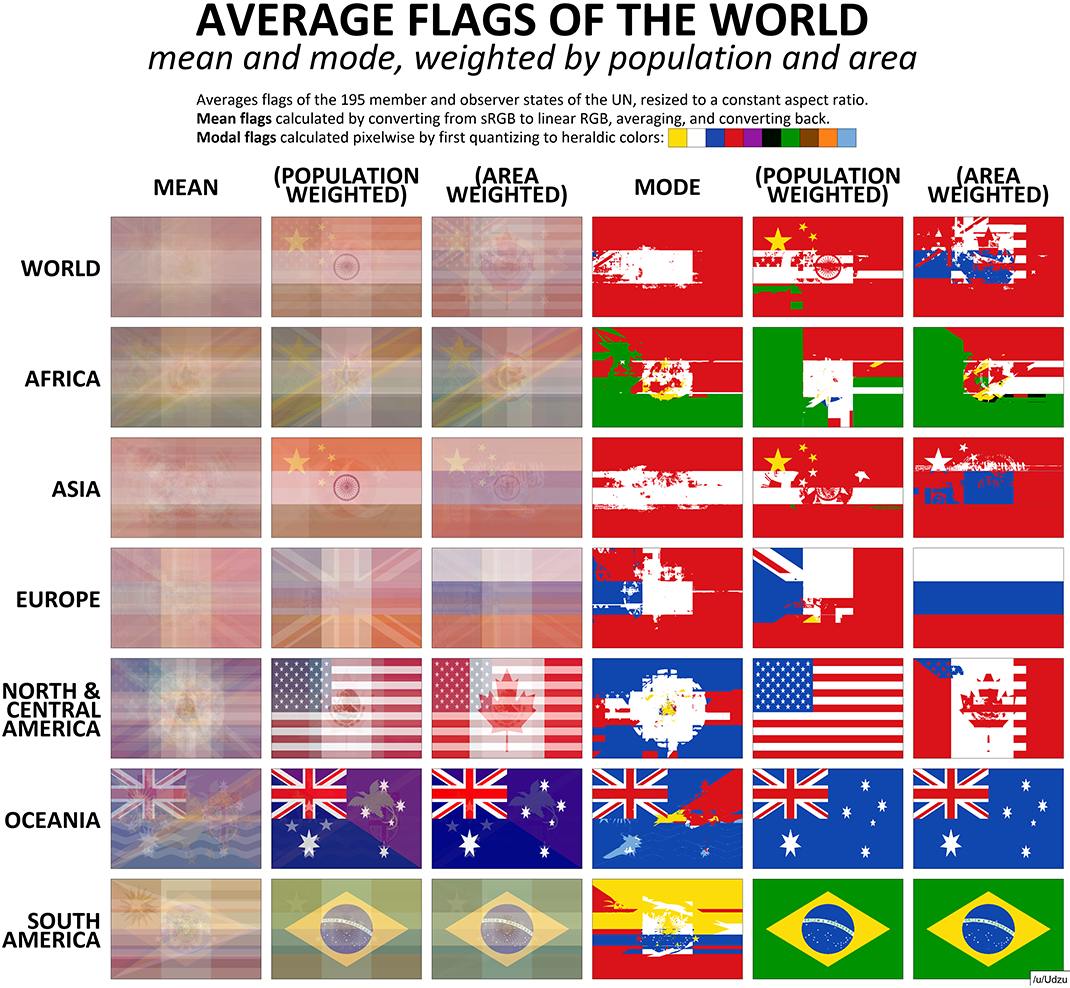
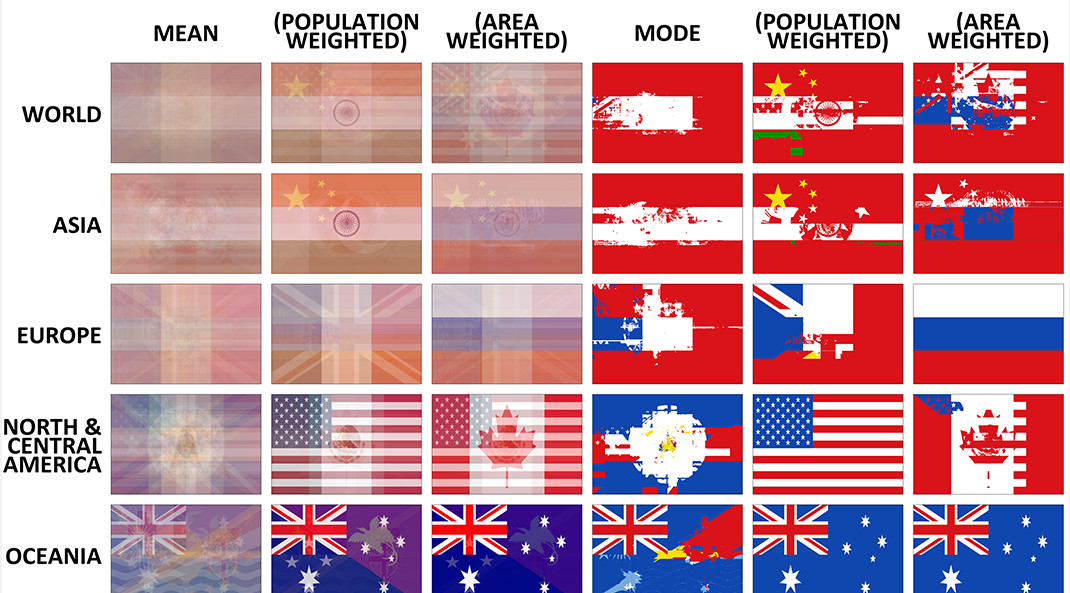
When all the world’s flags are averaged, the result is a hazy rectangle with outlines of popular flag layouts (e.g. tricolor, triband). That said, one feature that does stand out is the Union Jack in the top left corner, showing that Great Britain’s historical influence lives on even through flag design.
Russia, even with its landmass divided in two, is prominent on both Europe and Asia’s area-weighted graphics.
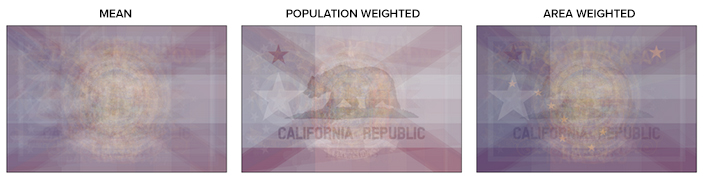
Interestingly, Udzu also repeated the process using U.S. state flags. As one would expect, California and Texas dominate the population-weighted image. In the area-weighted version, Alaska’s big dipper flag and the word “Montana” become more prominent.
Examining the Building Blocks of Flags
Flags are fascinating for a number of reasons.
They’re loaded with history, charged with patriotic pride, and commonalities between flags often signal connections between the people who live in those respective countries.
These serious considerations aside, flags are fun to look at from a design perspective. There are nearly two hundred official countries in the world, and many of them embrace similarly minimalist flag layouts. As a result, it’s no surprise that some of them are strikingly similar.
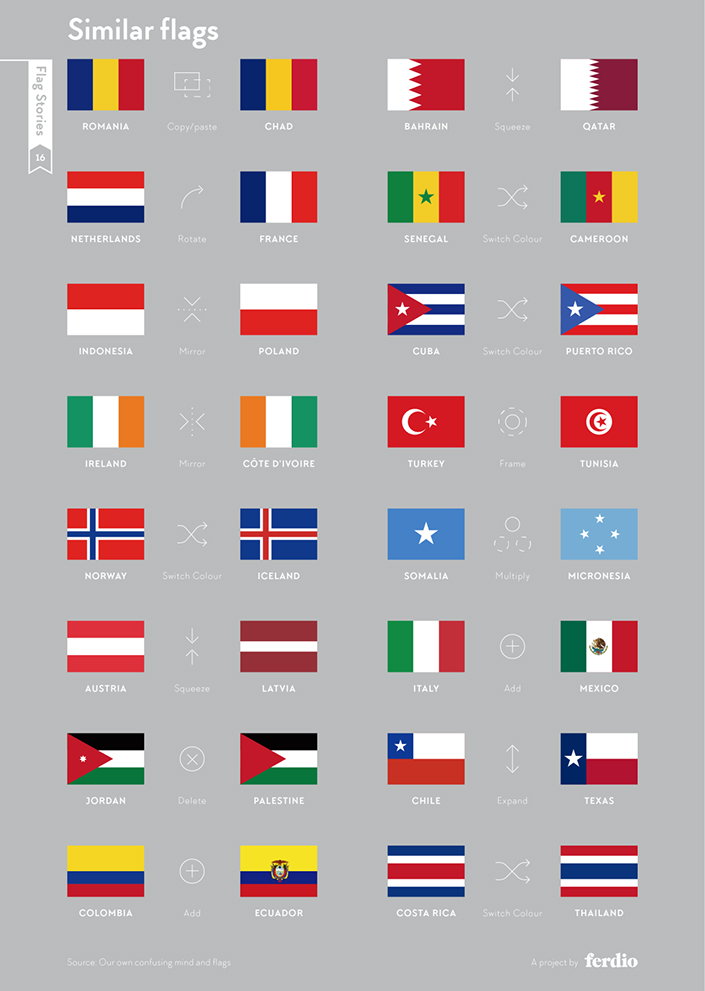
Source: Flag Stories
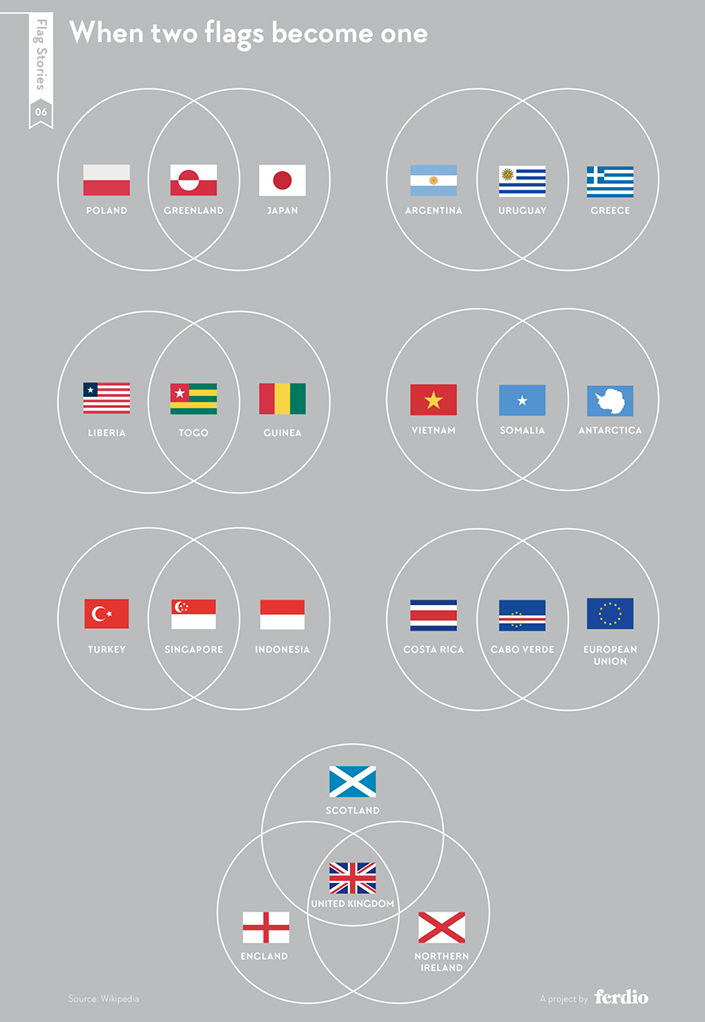
With many similar colors and layouts in the roster of national flags, it seems like every combination is taken.
However, as the visualization below identifies, a few specific combinations are still up for grabs.
Source: Flag Stories
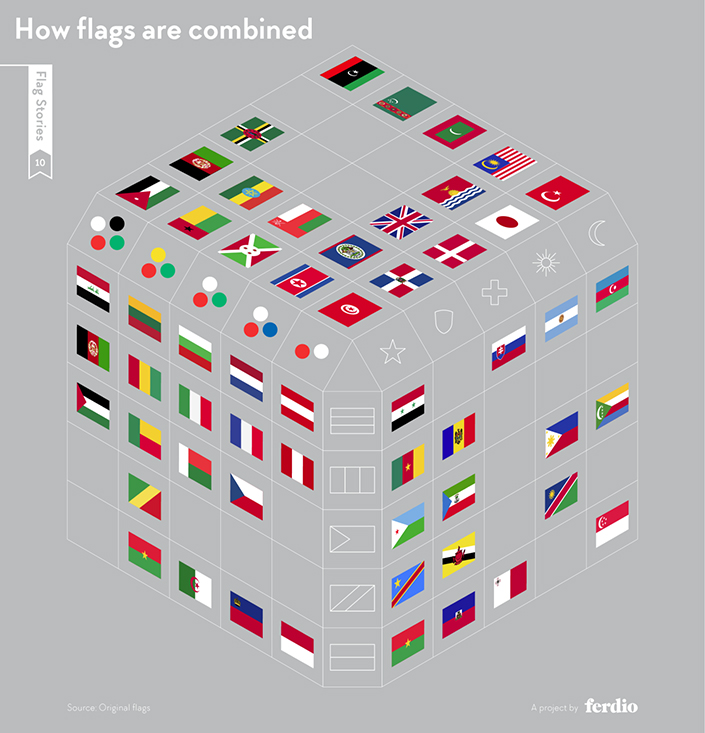
In case anyone out there is thinking of forming a new country, combining elements from different flags is a valid approach. Joking aside, the Union Jack really was created by combining aspects of the three older national flags of England, Scotland, and Northern Ireland.
Source: Flag Stories


Politics
Charted: Trust in Government Institutions by G7 Countries
How much do you trust the government and its various institutions? We look at data for G7 countries for the time period of 2006-2023.


Trust in Government Institutions by G7 Countries
This was originally posted on our Voronoi app. Download the app for free on iOS or Android and discover incredible data-driven charts from a variety of trusted sources.
How much do you trust the government, and its various institutions?
It’s likely that your level of confidence probably depends on a wide range of factors, such as perceived competency, historical context, economic performance, accountability, social cohesion, and transparency.
And for these same reasons, trust levels in government institutions also change all the time, even in the world’s most developed countries: the G7.
Confidence in Government by G7 Countries (2006-2023)
This chart looks at the changes in trust in government institutions between the years 2006 and 2023, based on data from a multi-country Gallup poll.
Specifically, this dataset aggregates confidence in multiple national institutions, including the military, the judicial system, the national government, and the integrity of the electoral system.
| Country | Confidence (2006) | Confidence (2023) | Change (p.p.) |
|---|---|---|---|
| Canada | 57% | 64% | +7 |
| Britain | 63% | 63% | +0 |
| Germany | 55% | 61% | +6 |
| France | 54% | 60% | +6 |
| Japan | 48% | 59% | +11 |
| Italy | 41% | 54% | +13 |
| United States | 63% | 50% | -13 |
What’s interesting here is that in the G7, a group of the world’s most developed economies, there is only one country bucking the general trend: the United States.
Across most G7 countries, confidence in institutions has either improved or stayed the same between 2006 and 2023. The largest percentage point (p.p.) increases occur in Italy and Japan, which saw +13 p.p. and +11 p.p. increases in trust over the time period.
In the U.S., however, confidence in government institutions has fallen by 13 p.p. over the years. What happened?
Key Figures on U.S. Trust in Institutions
In 2006, the U.S. was tied with the UK as having the highest confidence in government institutions, at 63%.
But here’s where the scores stand in 2023, across various institutions:
| 🇺🇸 Institutions | Confidence (2023) |
|---|---|
| Military | 81% |
| Judiciary | 42% |
| National Government | 30% |
| Elections | 44% |
| Overall | 49% |
Based on this data, it’s clear that the U.S. lags behind in three key indicators: confidence in the national government, confidence in the justice system, and confidence in fair elections. It ranked in last place for each indicator in the G7.
One other data point that stands out: despite leading the world in military spending, the U.S. is only the third most confident in its military in the G7. It lags behind France (86%) and the United Kingdom (83%).

-

 Technology6 days ago
All of the Grants Given by the U.S. CHIPS Act
-

 Uranium2 weeks ago
The World’s Biggest Nuclear Energy Producers
-

 Education2 weeks ago
How Hard Is It to Get Into an Ivy League School?
-

 Debt2 weeks ago
How Debt-to-GDP Ratios Have Changed Since 2000
-

 Sports2 weeks ago
The Highest Earning Athletes in Seven Professional Sports
-

 Science2 weeks ago
Visualizing the Average Lifespans of Mammals
-

 Brands1 week ago
How Tech Logos Have Evolved Over Time
-

 Energy1 week ago
Ranked: The Top 10 EV Battery Manufacturers in 2023