Misc
The Iceberg That Sinks Organizational Culture Change
Most people are aware of the incredible power that company culture has in making or breaking a company.
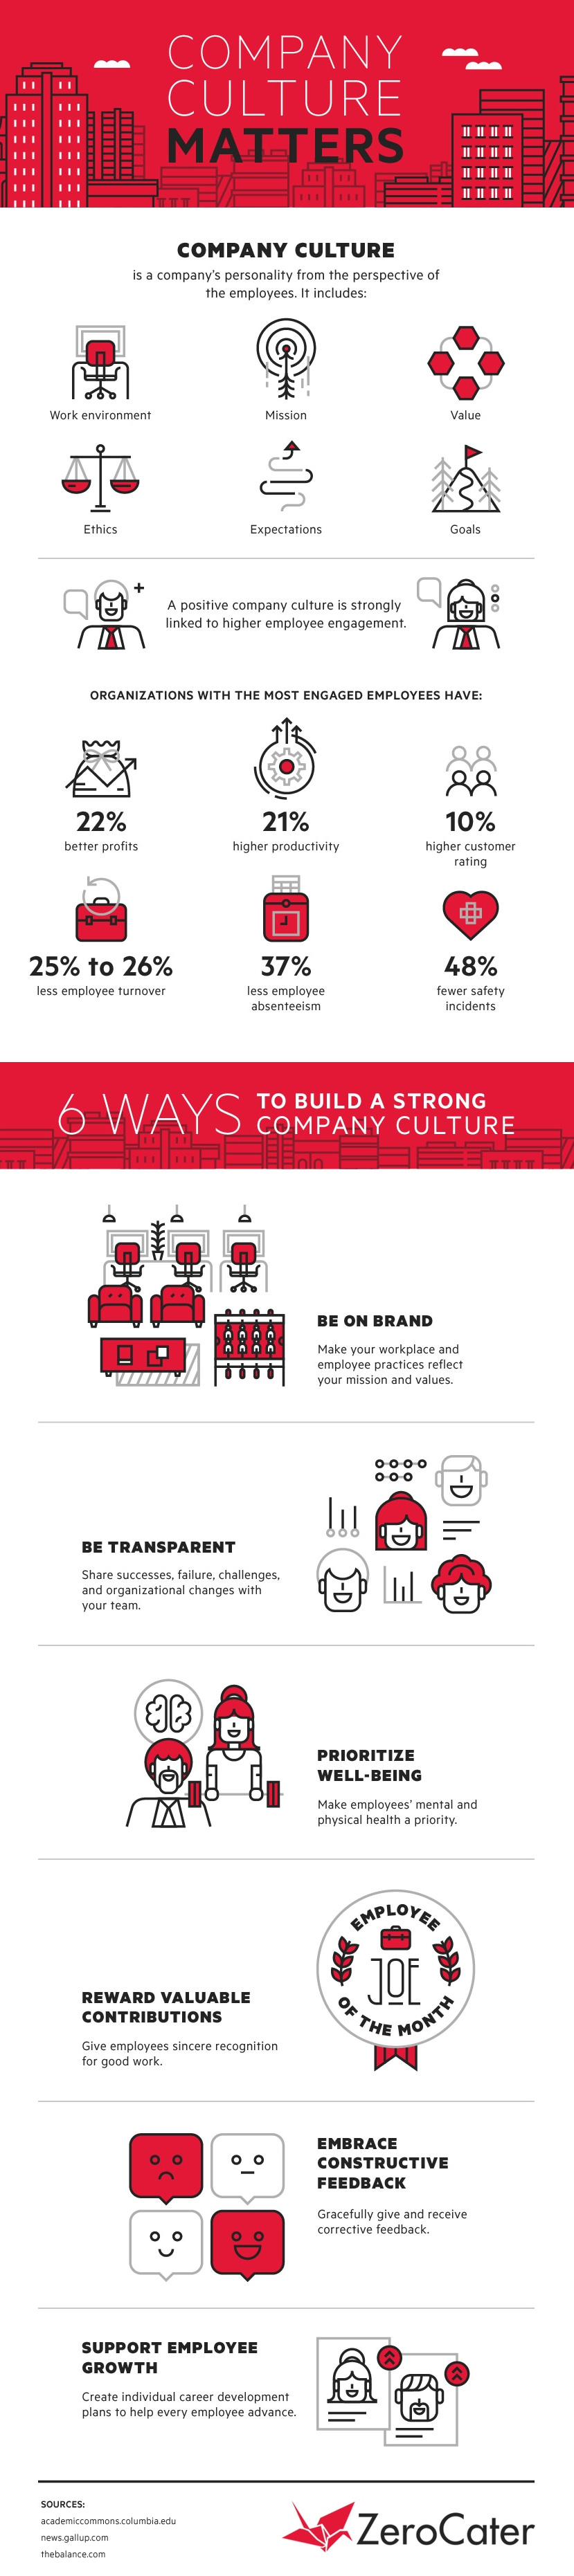
While the concept of culture seems qualitative and fuzzy to many entrepreneurs or managers, the research on the impact of culture on organizations is very clear and data-driven. Companies with highly-engaged employees have low turnover, high productivity, more satisfied customers, and higher profits.
To sum it up culture’s potential impact more succinctly, management guru Peter Drucker famously put it a different way: “Culture eats strategy for breakfast.”
The Pitfalls of Culture Change
The benefits of a strong company culture are many – and it’s no surprise to see companies all over the world aspiring to build world-class cultures within their organizations at almost any cost.
The problem is that company culture, just like the culture that permeates through society, is based on hidden sets of assumptions, social norms, traditions, and unwritten rules that represent the way things actually get done in a company. As a result, decision makers often underestimate how challenging cultural change can be.
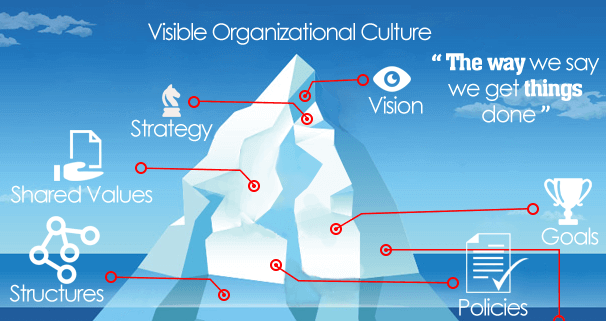
Today’s infographic comes from executive consultant Torben Rick, and it uses an iceberg analogy to show why organizational culture change sinks so many ships. At the top of the mass, there are visible indicators of a culture – but underneath is a bigger, invisible mass that holds all the ingrained cultural assumptions that are extremely difficult to affect.
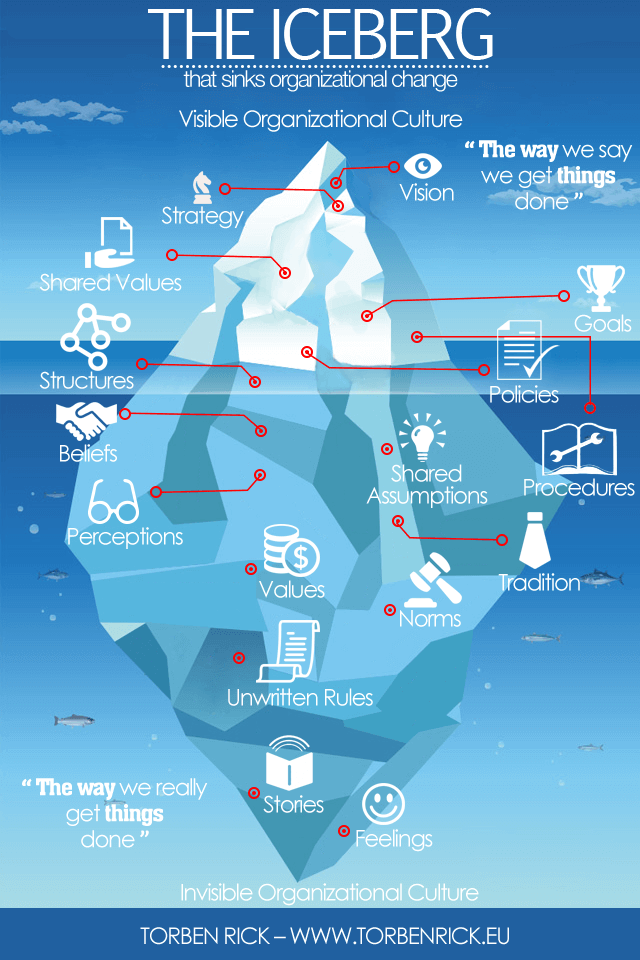
As Torben Rick puts it, the iceberg represents “the way we say we get things done” in contrast to the deeply-ingrained “way that things actually get done” within an organization.
In other words, for managers to positively affect cultural change, they not only need to address the top of the iceberg (vision, mission, values, etc.) but they must also make inroads on the bottom of the iceberg, which makes up more like 90% of a company’s actual culture.
Unfortunately, transforming these underlying perceptions, traditions, and shared assumptions is the real hard part of the exercise, and it can take many months or even years to see the results of such initiatives.
How to Build a Strong Company Culture
Cultural change cannot happen in one week of meetings, or through a few memos sent from higher ups. To effectively shape the bottom of the iceberg – those deeply-ingrained beliefs held throughout the organization – change must happen over a longer period of time where leading is done by example, and employees have the support they need to grow.
The following infographic from ZeroCater offers six ways to help get you started in building a strong culture.
As you embark on your voyage to build a stronger company culture, remember that organizational change is more complex and ingrained than it initially seems.
The amount of companies that are successful in these endeavors is far fewer than the amount that have tried – and this iceberg of organizational culture change has sunk many ships over time.


VC+
VC+: Get Our Key Takeaways From the IMF’s World Economic Outlook
A sneak preview of the exclusive VC+ Special Dispatch—your shortcut to understanding IMF’s World Economic Outlook report.

Have you read IMF’s latest World Economic Outlook yet? At a daunting 202 pages, we don’t blame you if it’s still on your to-do list.
But don’t worry, you don’t need to read the whole April release, because we’ve already done the hard work for you.
To save you time and effort, the Visual Capitalist team has compiled a visual analysis of everything you need to know from the report—and our upcoming VC+ Special Dispatch will be available exclusively to VC+ members on Thursday, April 25th.
If you’re not already subscribed to VC+, make sure you sign up now to receive the full analysis of the IMF report, and more (we release similar deep dives every week).
For now, here’s what VC+ members can expect to receive.
Your Shortcut to Understanding IMF’s World Economic Outlook
With long and short-term growth prospects declining for many countries around the world, this Special Dispatch offers a visual analysis of the key figures and takeaways from the IMF’s report including:
- The global decline in economic growth forecasts
- Real GDP growth and inflation forecasts for major nations in 2024
- When interest rate cuts will happen and interest rate forecasts
- How debt-to-GDP ratios have changed since 2000
- And much more!

Get the Full Breakdown in the Next VC+ Special Dispatch
VC+ members will receive the full Special Dispatch on Thursday, April 25th.
Make sure you join VC+ now to receive exclusive charts and the full analysis of key takeaways from IMF’s World Economic Outlook.
Don’t miss out. Become a VC+ member today.
What You Get When You Become a VC+ Member
VC+ is Visual Capitalist’s premium subscription. As a member, you’ll get the following:
- Special Dispatches: Deep dive visual briefings on crucial reports and global trends
- Markets This Month: A snappy summary of the state of the markets and what to look out for
- The Trendline: Weekly curation of the best visualizations from across the globe
- Global Forecast Series: Our flagship annual report that covers everything you need to know related to the economy, markets, geopolitics, and the latest tech trends
- VC+ Archive: Hundreds of previously released VC+ briefings and reports that you’ve been missing out on, all in one dedicated hub
You can get all of the above, and more, by joining VC+ today.

-

 Markets1 week ago
U.S. Debt Interest Payments Reach $1 Trillion
-

 Business2 weeks ago
Charted: Big Four Market Share by S&P 500 Audits
-

 Real Estate2 weeks ago
Ranked: The Most Valuable Housing Markets in America
-

 Money2 weeks ago
Which States Have the Highest Minimum Wage in America?
-

 AI2 weeks ago
Ranked: Semiconductor Companies by Industry Revenue Share
-

 Markets2 weeks ago
Ranked: The World’s Top Flight Routes, by Revenue
-

 Demographics2 weeks ago
Population Projections: The World’s 6 Largest Countries in 2075
-

 Markets2 weeks ago
The Top 10 States by Real GDP Growth in 2023