Markets
Visualized: A Global Risk Assessment of 2022 and Beyond


Visualized: A Global Risk Assessment of 2022 and Beyond
Since the start of the global pandemic, we’ve been navigating through tumultuous waters, and this year is expected to be as unpredictable as ever.
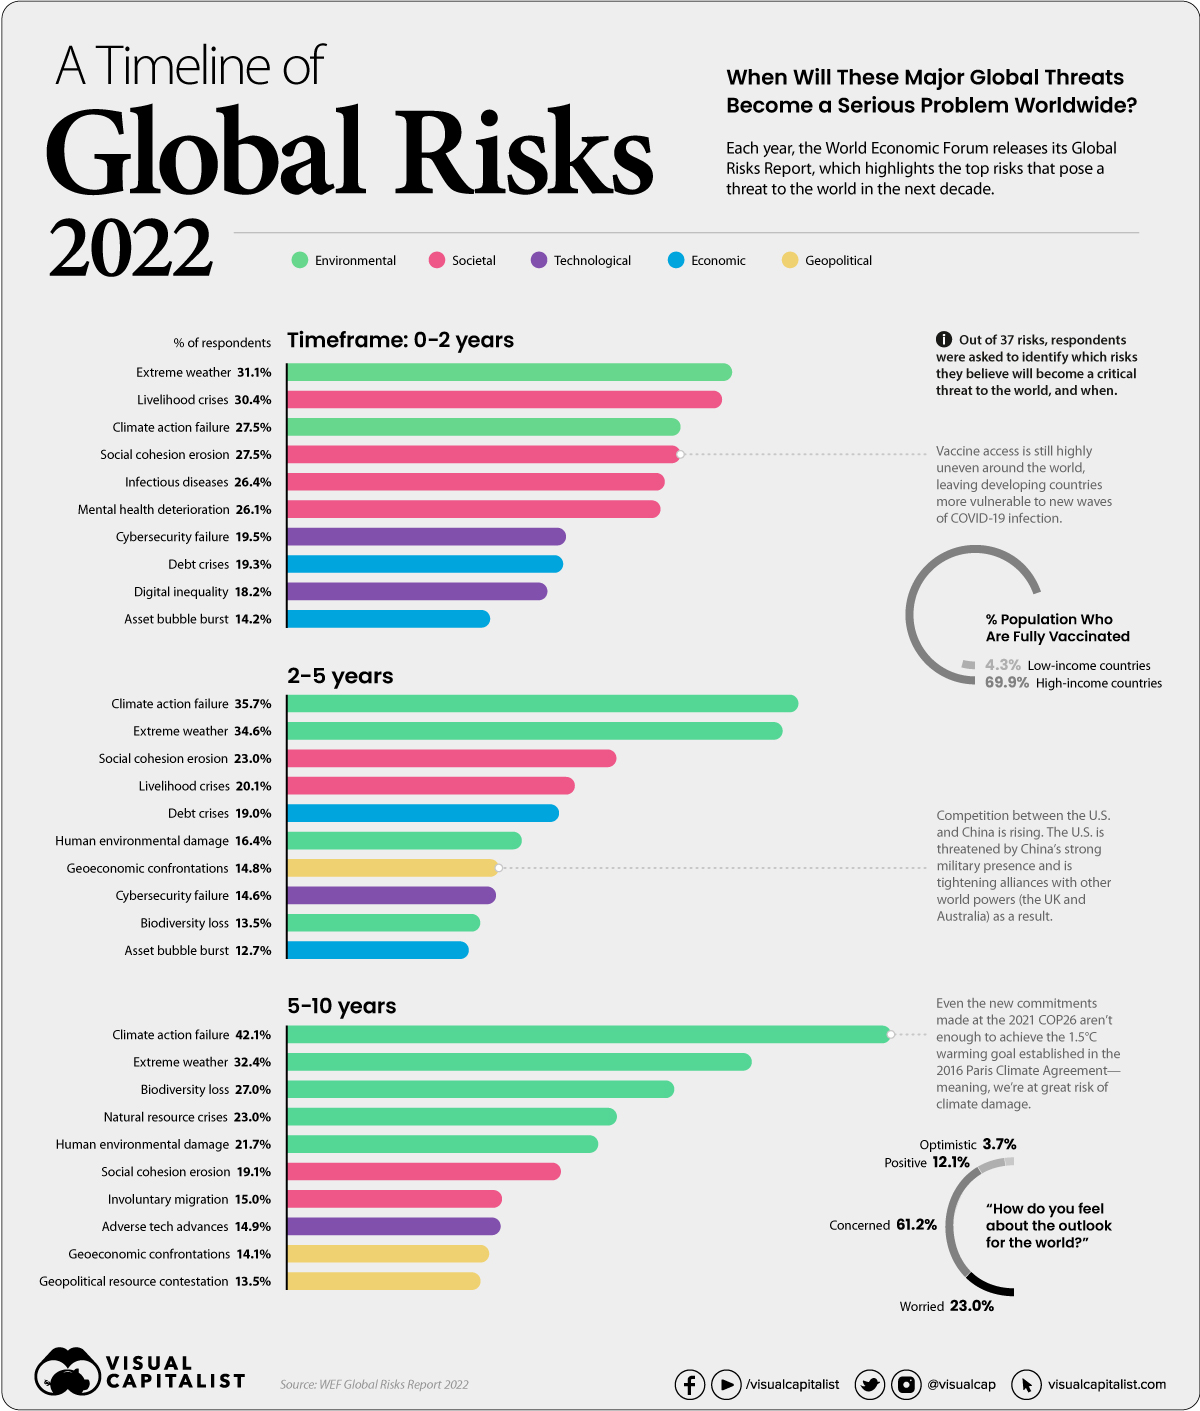
In the latest annual edition of the Global Risks Report by the World Economic Forum (WEF), it was found that a majority of global leaders feel worried or concerned about the outlook of the world, and only 3.7% feel optimistic.
Ever year, the report identifies the top risks facing the world, as identified by nearly 1,000 surveyed experts and leaders across various disciplines, organizations, and geographies.
What global risks are leaders and experts most concerned about, and which ones are posing imminent threats? Let’s dive into the key findings from the report.
Methodology for WEF’s Global Risk Assessment
In the survey, respondents were asked to compare 37 different risks, which were broken down into five categories: economic, environmental, geopolitical, societal, and technological.
To get a sense of which risks were seen as more urgent than others, respondents were asked to identify when they believed these threats would become a serious problem to the world, based on the following timeframes:
- Short-term threats: 0-2 years
- Medium-term threats: 2-5 years
- Long-term threats: 5-10 years
By categorizing global risks into these time horizons, it helps provide a better idea of the problems that decision makers and governments may have to deal with in the near future, and how these risks may interrelate with one another.
Short-Term Risks
When it comes to short-term threats, respondents identified societal risks such as “the erosion of social cohesion” and “livelihood crises” as the most immediate risks to the world.
| Timeframe | Category | Threat | % of Respondents |
|---|---|---|---|
| 0-2 years | 🟢 Environmental | Extreme weather | 31.1% |
| 0-2 years | 🔴 Societal | Livelihood crises | 30.4% |
| 0-2 years | 🟢 Environmental | Climate action failure | 27.5% |
| 0-2 years | 🔴 Societal | Social cohesion erosion | 27.5% |
| 0-2 years | 🔴 Societal | Infectious diseases | 26.4% |
| 0-2 years | 🔴 Societal | Mental health deterioration | 26.1% |
| 0-2 years | 🟣 Technological | Cybersecurity failure | 19.5% |
| 0-2 years | 🔵 Economic | Debt crises | 19.3% |
| 0-2 years | 🟣 Technological | Digital inequality | 18.2% |
| 0-2 years | 🔵 Economic | Asset bubble burst | 14.2% |
These societal risks have worsened since the start of COVID-19. And as emerging variants threaten our journey towards normalcy, the pandemic continues to wreak havoc worldwide, with no immediate signs of slowing down.
According to respondents, one problem triggered by the pandemic is rising inequality, both worldwide and within countries.
Many developed economies managed to adapt as office workers pivoted to remote and hybrid work, though many industries, such as hospitality, still face significant headwinds. Easy access to vaccines has helped these countries mitigate the worst effects of outbreaks.
Regions with low access to vaccines have not been so fortunate, and the economic divide could become more apparent as the pandemic stretches on.
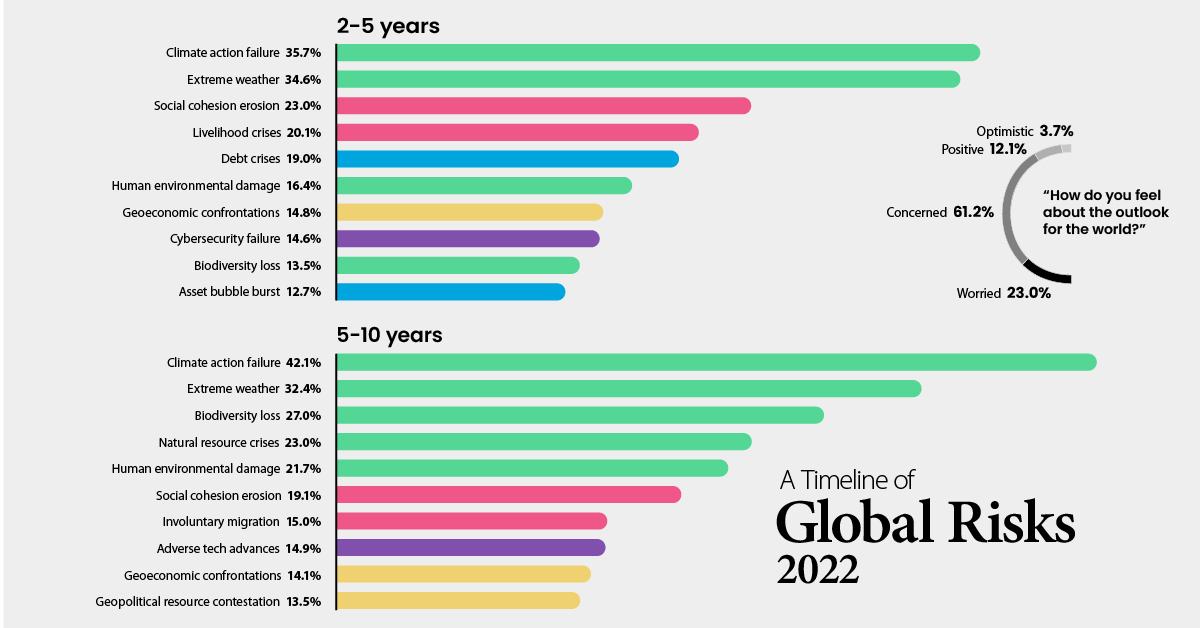
Medium-Term Risks
A majority of respondents believe we’ll continue to struggle with pandemic-related issues for the next three years. Because of this, the medium-term risks identified by respondents are fairly similar to the short-term risks.
| Timeframe | Category | Threat | % of Respondents |
|---|---|---|---|
| 2-5 years | 🟢 Environmental | Climate action failure | 35.7% |
| 2-5 years | 🟢 Environmental | Extreme weather | 34.6% |
| 2-5 years | 🔴 Societal | Social cohesion erosion | 23.0% |
| 2-5 years | 🔴 Societal | Livelihood crises | 20.1% |
| 2-5 years | 🔵 Economic | Debt crises | 19.0% |
| 2-5 years | 🟢 Environmental | Human environmental damage | 16.4% |
| 2-5 years | 🟡 Geopolitical | Geoeconomic confrontations | 14.8% |
| 2-5 years | 🟣 Technological | Cybersecurity failure | 14.6% |
| 2-5 years | 🟢 Environmental | Biodiversity loss | 13.5% |
| 2-5 years | 🔵 Economic | Asset bubble burst | 12.7% |
The pressing issues caused by COVID-19 mean that many key governments and decision-makers are struggling to prioritize long-term planning, and no longer have the capacity to help out with global issues. For example, the UK government postponed its foreign aid target until at least 2024. If countries continue to prioritize themselves in an effort to mitigate the impact of COVID-19, the inequality gap could widen even further.
Respondents also worry about rising debt levels triggering a crisis. The debt-to-GDP ratio globally spiked by 13 percentage points in 2020, a figure that will almost certainly continue to rise in the near future.
Long-Term Risks
Respondents identified climate change as the biggest threat to humanity in the next decade.
| Timeframe | Category | Threat | % of Respondents |
|---|---|---|---|
| 5-10 years | 🟢 Environmental | Climate action failure | 42.1% |
| 5-10 years | 🟢 Environmental | Extreme weather | 32.4% |
| 5-10 years | 🟢 Environmental | Biodiversity loss | 27.0% |
| 5-10 years | 🟢 Environmental | Natural resource crises | 23.0% |
| 5-10 years | 🟢 Environmental | Human environmental damage | 21.7% |
| 5-10 years | 🔴 Societal | Social cohesion erosion | 19.1% |
| 5-10 years | 🔴 Societal | Involuntary migration | 15.0% |
| 5-10 years | 🟣 Technological | Adverse tech advances | 14.9% |
| 5-10 years | 🟡 Geopolitical | Geoeconomic confrontations | 14.1% |
| 5-10 years | 🟡 Geopolitical | Geopolitical resource contestation | 13.5% |
Climate inaction—essentially business as usual—could lead to a global GDP loss between 4% and 18%, with varying impacts across different regions.
Experts also pointed out that current decarbonization commitments made at COP26 last year still aren’t enough to slow warming to the 1.5°C goal set in the Paris Climate Agreement, so more action is needed to mitigate environmental risk.
That said, efforts to curb climate change and solve long-term issues will likely have negative short-term impacts on the global economy and society. So risk mitigation efforts need to be in place as we work to reach net-zero and ultimately slow down climate change.
Risk Mitigation Efforts
People’s thoughts on risk mitigation were gauged in the WEF survey. Respondents were asked to identify which risks our world is most equipped to handle, and which ones they believe we’re less prepared for.
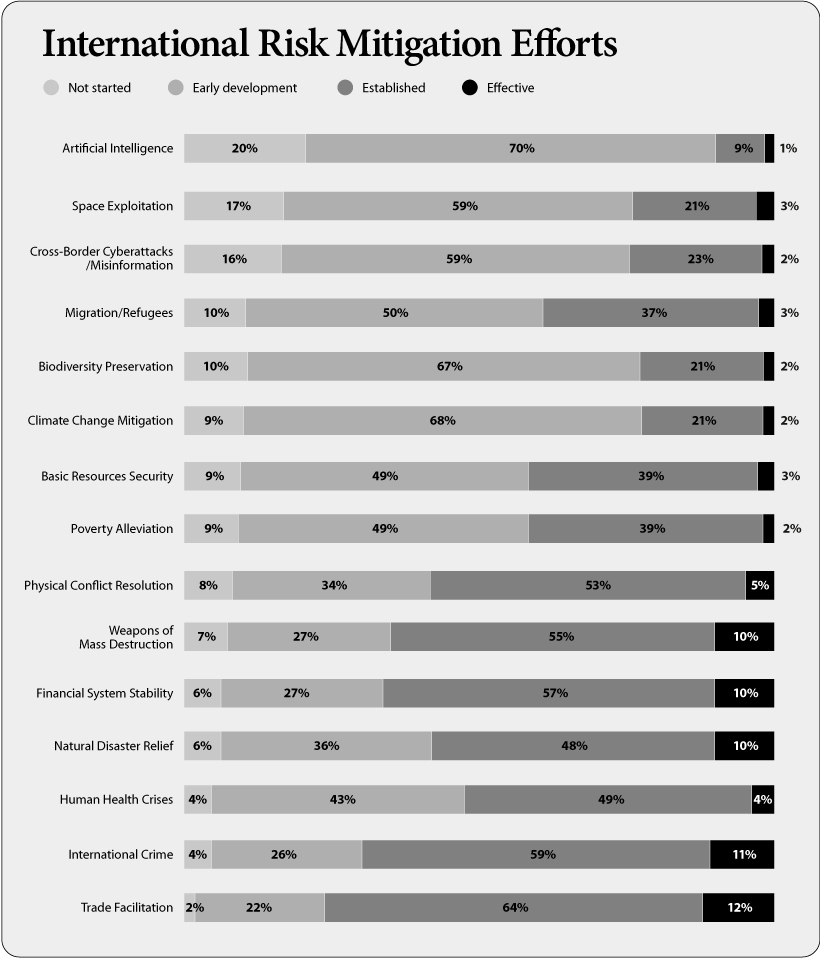
“Trade facilitation,” “international crime,” and “weapons of mass destruction” were risks that respondents felt we’ve effectively prepared for. On the flip side, “artificial intelligence” and “cross-border cyberattacks and misinformation” are areas where most respondents think we’re most unprotected against.
As society becomes increasingly reliant on digital infrastructure, experts predict we will see an uptick in cyber attacks and cybercrime. New AI-enabled technologies that offer ransomware-as-a-service allow anyone to engage in cybercrime—even those without the technical knowledge needed to build malware.
How Do We Move Forward?
Based on the findings from this year’s survey, WEF identified five lessons that governments, businesses, and decision-makers should utilize in order to build resilience and prepare for future challenges:
- Build a holistic mitigation framework: Rather than focusing on specific risks, it’s helpful to identify the big-picture worst-case scenario and work back from there. Build holistic systems that protect against adverse outcomes.
- Consider the entire ecosystem: Examine third-party services and external assets, and analyze the broader ecosystem in which you operate.
- Embrace diversity in resilience strategies: Not all strategies will work across the board. Complex problems will require nuanced efforts. Adaptability is key.
- Connect resilience efforts with other goals: Many resilience efforts could benefit multiple aspects of society. For instance, efficient supply chains could strengthen communities and contribute to environmental goals.
- Think of resilience as a journey, not a destination: Remaining agile and vigilant is vital when building out resilience programs, as these efforts are new and require reflection in order to improve.
The next few years will be riddled with complex challenges, and our best chance at mitigating these global risks is through increased collaboration and consistent reassessment.


Markets
Mapped: Europe’s GDP Per Capita, by Country
Which European economies are richest on a GDP per capita basis? This map shows the results for 44 countries across the continent.


Mapped: Europe’s GDP Per Capita, by Country (2024)
This was originally posted on our Voronoi app. Download the app for free on iOS or Android and discover incredible data-driven charts from a variety of trusted sources.
Europe is home to some of the largest and most sophisticated economies in the world. But how do countries in the region compare with each other on a per capita productivity basis?
In this map, we show Europe’s GDP per capita levels across 44 nations in current U.S. dollars. Data for this visualization and article is sourced from the International Monetary Fund (IMF) via their DataMapper tool, updated April 2024.
Europe’s Richest and Poorest Nations, By GDP Per Capita
Luxembourg, Ireland, and Switzerland, lead the list of Europe’s richest nations by GDP per capita, all above $100,000.
| Rank | Country | GDP Per Capita (2024) |
|---|---|---|
| 1 | 🇱🇺 Luxembourg | $131,380 |
| 2 | 🇮🇪 Ireland | $106,060 |
| 3 | 🇨🇭 Switzerland | $105,670 |
| 4 | 🇳🇴 Norway | $94,660 |
| 5 | 🇮🇸 Iceland | $84,590 |
| 6 | 🇩🇰 Denmark | $68,900 |
| 7 | 🇳🇱 Netherlands | $63,750 |
| 8 | 🇸🇲 San Marino | $59,410 |
| 9 | 🇦🇹 Austria | $59,230 |
| 10 | 🇸🇪 Sweden | $58,530 |
| 11 | 🇧🇪 Belgium | $55,540 |
| 12 | 🇫🇮 Finland | $55,130 |
| 13 | 🇩🇪 Germany | $54,290 |
| 14 | 🇬🇧 UK | $51,070 |
| 15 | 🇫🇷 France | $47,360 |
| 16 | 🇦🇩 Andorra | $44,900 |
| 17 | 🇲🇹 Malta | $41,740 |
| 18 | 🇮🇹 Italy | $39,580 |
| 19 | 🇨🇾 Cyprus | $37,150 |
| 20 | 🇪🇸 Spain | $34,050 |
| 21 | 🇸🇮 Slovenia | $34,030 |
| 22 | 🇪🇪 Estonia | $31,850 |
| 23 | 🇨🇿 Czech Republic | $29,800 |
| 24 | 🇵🇹 Portugal | $28,970 |
| 25 | 🇱🇹 Lithuania | $28,410 |
| 26 | 🇸🇰 Slovakia | $25,930 |
| 27 | 🇱🇻 Latvia | $24,190 |
| 28 | 🇬🇷 Greece | $23,970 |
| 29 | 🇭🇺 Hungary | $23,320 |
| 30 | 🇵🇱 Poland | $23,010 |
| 31 | 🇭🇷 Croatia | $22,970 |
| 32 | 🇷🇴 Romania | $19,530 |
| 33 | 🇧🇬 Bulgaria | $16,940 |
| 34 | 🇷🇺 Russia | $14,390 |
| 35 | 🇹🇷 Türkiye | $12,760 |
| 36 | 🇲🇪 Montenegro | $12,650 |
| 37 | 🇷🇸 Serbia | $12,380 |
| 38 | 🇦🇱 Albania | $8,920 |
| 39 | 🇧🇦 Bosnia & Herzegovina | $8,420 |
| 40 | 🇲🇰 North Macedonia | $7,690 |
| 41 | 🇧🇾 Belarus | $7,560 |
| 42 | 🇲🇩 Moldova | $7,490 |
| 43 | 🇽🇰 Kosovo | $6,390 |
| 44 | 🇺🇦 Ukraine | $5,660 |
| N/A | 🇪🇺 EU Average | $44,200 |
Note: Figures are rounded.
Three Nordic countries (Norway, Iceland, Denmark) also place highly, between $70,000-90,000. Other Nordic peers, Sweden and Finland rank just outside the top 10, between $55,000-60,000.
Meanwhile, Europe’s biggest economies in absolute terms, Germany, UK, and France, rank closer to the middle of the top 20, with GDP per capitas around $50,000.
Finally, at the end of the scale, Eastern Europe as a whole tends to have much lower per capita GDPs. In that group, Ukraine ranks last, at $5,660.
A Closer Look at Ukraine
For a broader comparison, Ukraine’s per capita GDP is similar to Iran ($5,310), El Salvador ($5,540), and Guatemala ($5,680).
According to experts, Ukraine’s economy has historically underperformed to expectations. After the fall of the Berlin Wall, the economy contracted for five straight years. Its transition to a Western, liberalized economic structure was overshadowed by widespread corruption, a limited taxpool, and few revenue sources.
Politically, its transformation from authoritarian regime to civil democracy has proved difficult, especially when it comes to institution building.
Finally, after the 2022 invasion of the country, Ukraine’s GDP contracted by 30% in a single year—the largest loss since independence. Large scale emigration—to the tune of six million refugees—is also playing a role.
Despite these challenges, the country’s economic growth has somewhat stabilized while fighting continues.

-

 Markets6 days ago
The World’s Fastest Growing Emerging Markets (2024-2029 Forecast)
-

 Technology2 weeks ago
All of the Grants Given by the U.S. CHIPS Act
-

 Green2 weeks ago
The Carbon Footprint of Major Travel Methods
-

 United States2 weeks ago
Visualizing the Most Common Pets in the U.S.
-

 Culture2 weeks ago
The World’s Top Media Franchises by All-Time Revenue
-

 Visual Capitalist1 week ago
Best Visualizations of April on the Voronoi App
-

 Wealth1 week ago
Charted: Which Country Has the Most Billionaires in 2024?
-

 Markets1 week ago
The Top Private Equity Firms by Country