
Cloud computing service providers generated $270 billion in revenues last year, concentrated among a few giants.


click for more →


Scan with your phone's camera or QR code app to view
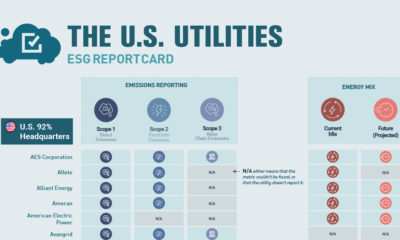

This graphic acts as an ESG report card that tracks the ESG metrics reported by different utilities in the U.S.—what gets left out?
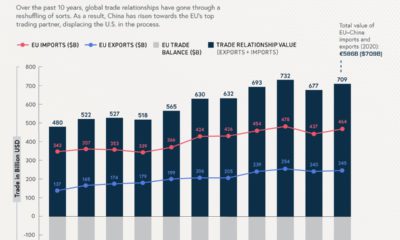

China has spearheaded its economy towards a global superpower, and as a result, has overtaken the U.S. as the EUs top trade partner
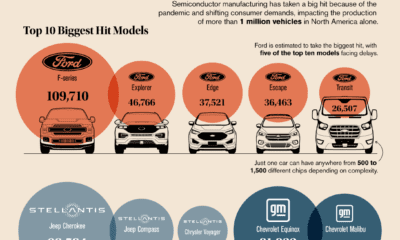

As the global chip shortage causes delays in automotive production, what models and manufacturers are being hit the hardest?
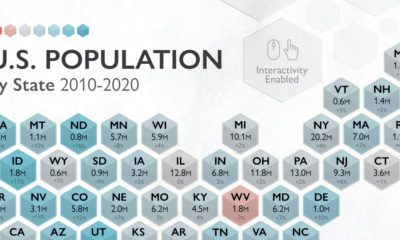

The U.S. saw 7.4% population growth in the past decade, the lowest it's been since the 1930s. How does population by state look today?
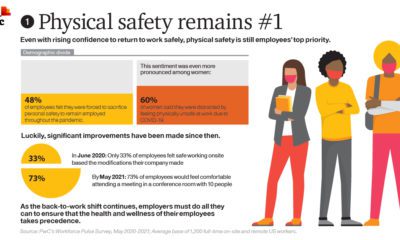

The pandemic has put the workforce through the wringer. This year-long survey highlights the four biggest back-to-work priorities and challenges that must be addressed.
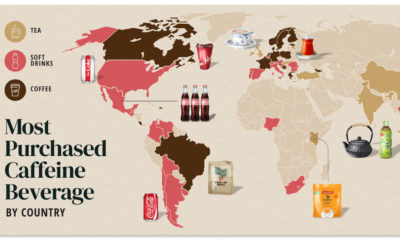

Do you drink coffee, tea, or cola? Each country has their own drink preference.
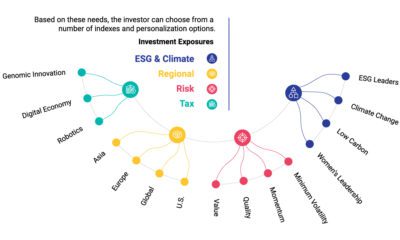

Direct indexing allows investors to build custom portfolios. Here is how they help investors reduce tax, optimize risk, and boost ESG scores.


This animated map shows the last billion years of Earth's tectonic plate movement in just 40 seconds.
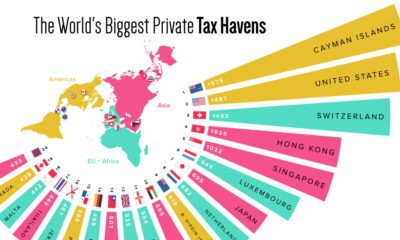

What countries or territories do the ultra-wealthy use as tax havens?
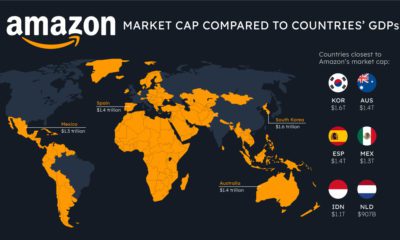

How do the big tech giants compare to entire countries? Here's how Apple, Microsoft, and Amazon's market caps stack up against national GDP.


Plant-based medical treatments have massive potential, but a few key issues are holding the industry back. Here’s how big data could help.
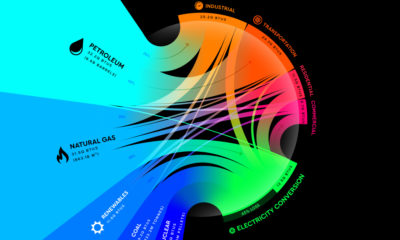

From renewables to fossil fuels, we've visualized the diverse mix of energy sources that powered U.S. energy consumption in 2020.
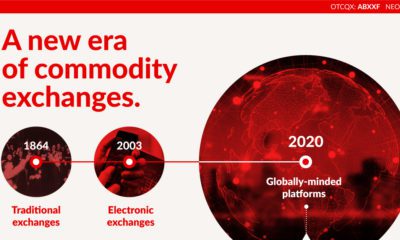

This infographic explores the evolution of commodity trading and exchanges as the world transitions to clean energy.
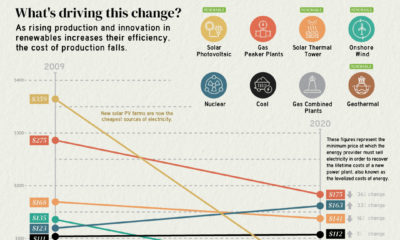

The cost of electricity from solar PV plants has decreased by 90% since 2009, highlighting the rapidly changing economics of electricity production.
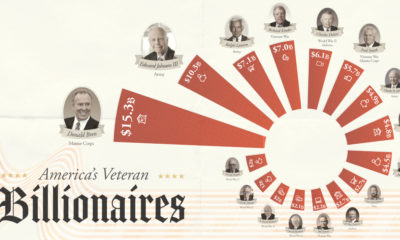

There are over 18 million living veterans in the U.S., but how many are ultra wealthy? This visual ranks the richest veterans in America.
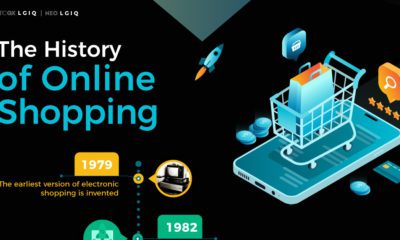

Online shopping has evolved rapidly over the last few decades ago. Here’s a look at how much it's evolved since its emergence in the late 70s.


This month, we dive into bonus content from our highly requested guide to data visualizations, as well as topical news in charts.


