Tracked: The U.S. Utilities ESG Report Card
The following content is sponsored by the National Public Utilities Council
Tracked: The U.S. Utilities ESG Report Card
As emissions reductions and sustainable practices become more important for electrical utilities, environmental, social, and governance (ESG) reporting is coming under increased scrutiny.
Once seen as optional by most companies, ESG reports and sustainability plans have become commonplace in the power industry. In addition to reporting what’s needed by regulatory state laws, many utilities utilize reporting frameworks like the Edison Electric Institute’s (EEI) ESG Initiative or the Global Reporting Initiative (GRI) Standards.
But inconsistent regulations, mixed definitions, and perceived importance levels have led some utilities to report significantly more environmental metrics than others.
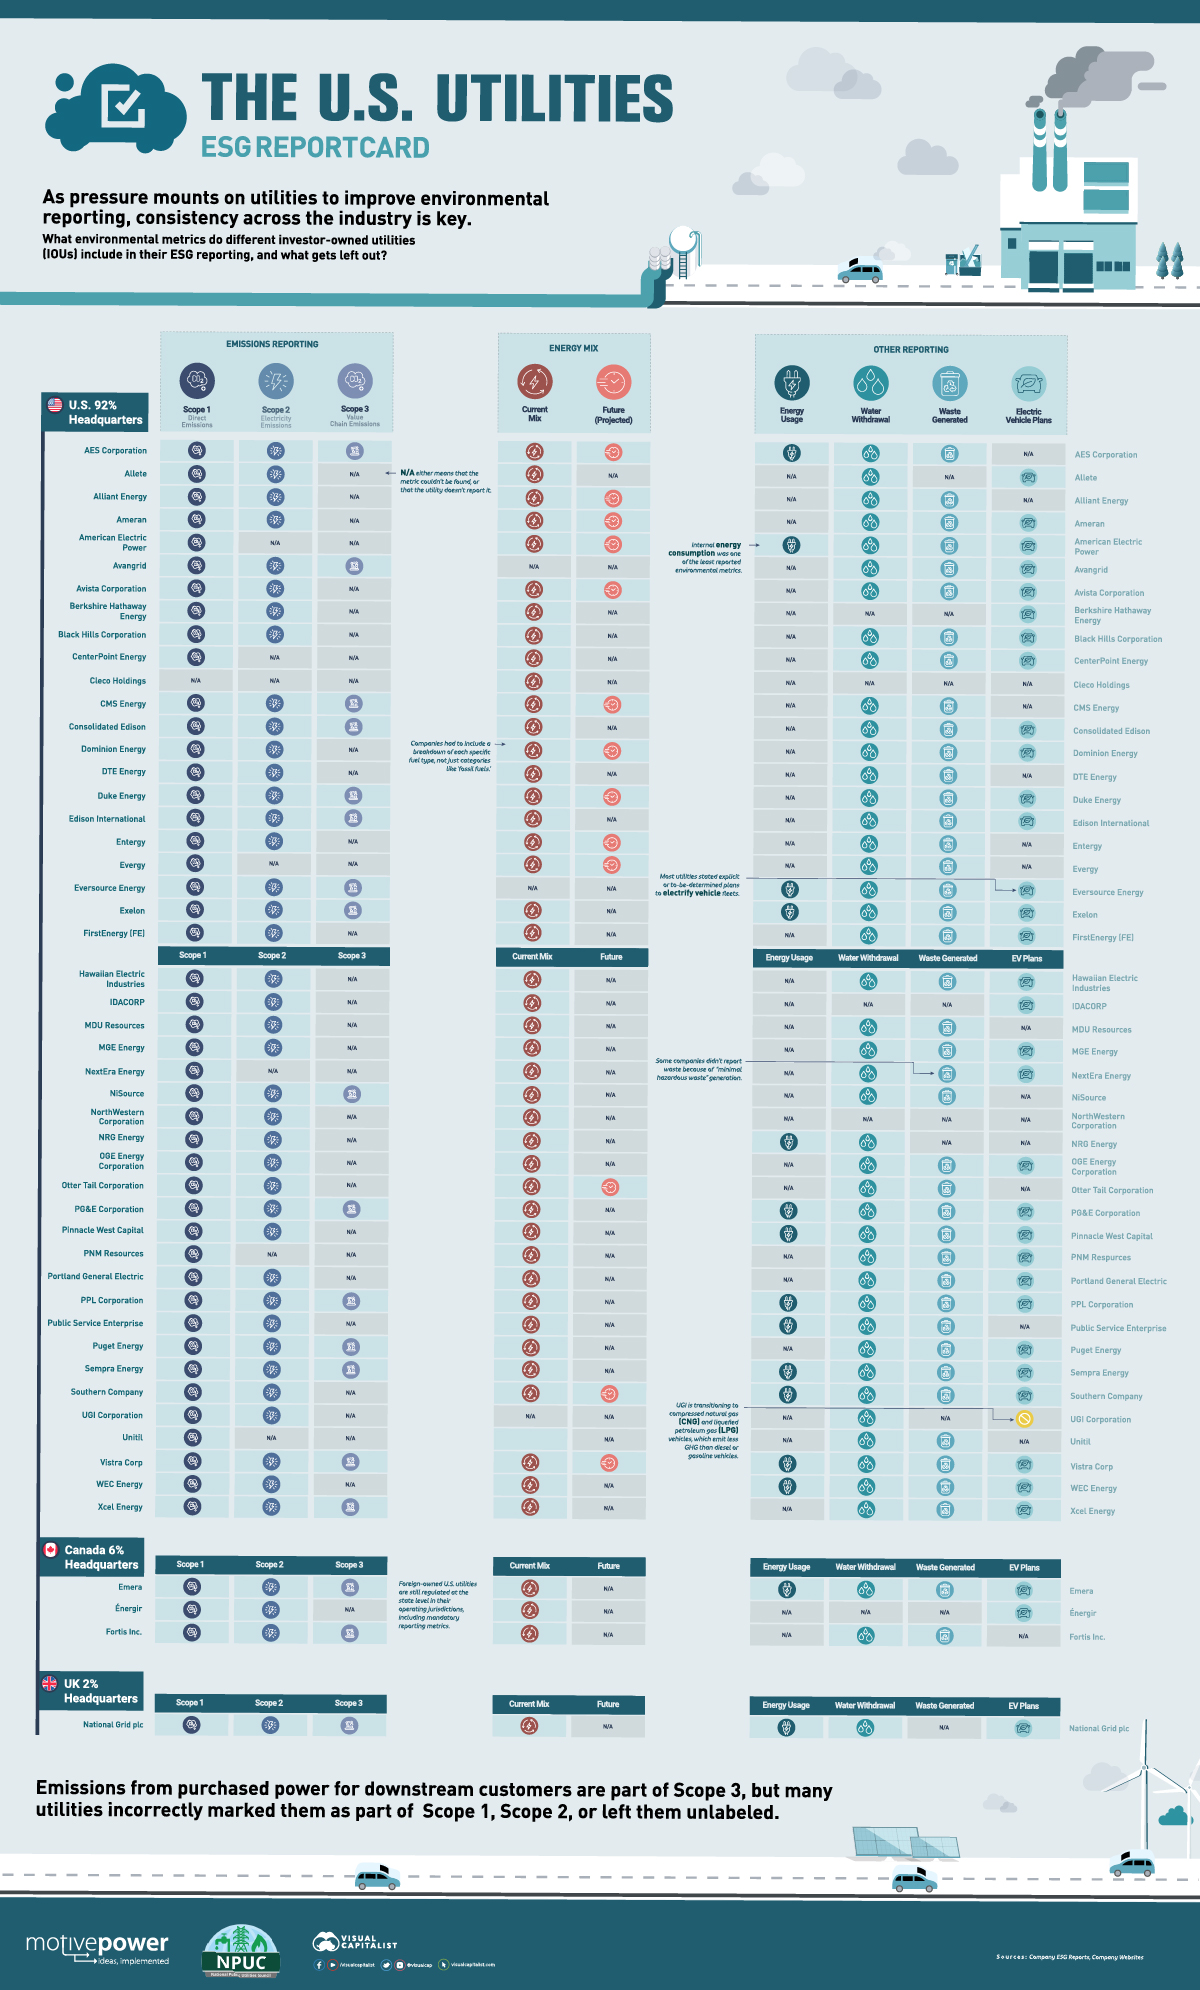
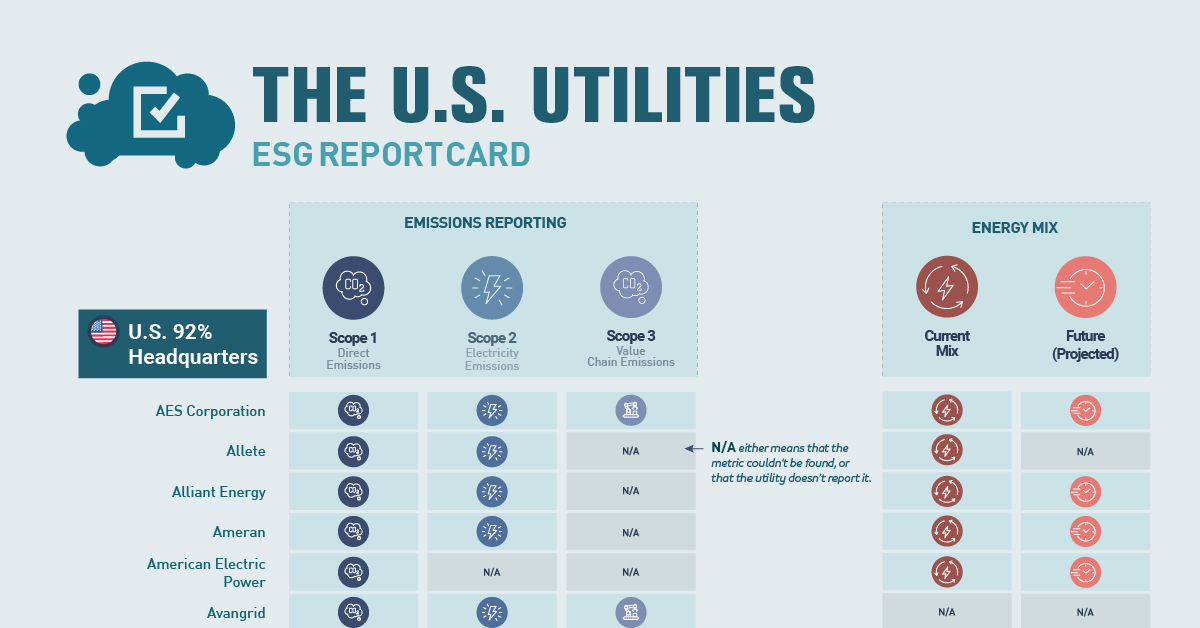
How do U.S. utilities’ ESG reports stack up? This infographic from the National Public Utilities Council tracks the ESG metrics reported by 50 different U.S. based investor-owned utilities (IOUs).
What’s Consistent Across ESG Reports
To complete the assessment of U.S. utilities, ESG reports, sustainability plans, and company websites were examined. A metric was considered tracked if it had concrete numbers provided, so vague wording or non-detailed projections weren’t included.
Of the 50 IOU parent companies analyzed, 46 have headquarters in the U.S. while four are foreign-owned, but all are regulated by the states in which they operate.
For a few of the most agreed-upon and regulated measures, U.S. utilities tracked them almost across the board. These included direct scope 1 emissions from generated electricity, the utility’s current fuel mix, and water and waste treatment.
Another commonly reported metric was scope 2 emissions, which include electricity emissions purchased by the utility companies for company consumption. However, a majority of the reporting utilities labeled all purchased electricity emissions as scope 2, even though purchased electricity for downstream consumers are traditionally considered scope 3 or value-chain emissions:
- Scope 1: Direct (owned) emissions.
- Scope 2: Indirect electricity emissions from internal electricity consumption. Includes purchased power for internal company usage (heat, electrical).
- Scope 3: Indirect value-chain emissions, including purchased goods/services (including electricity for non-internal use), business travel, and waste.
ESG Inconsistencies, Confusion, and Unimportance
Even putting aside mixed definitions and labeling, there were many inconsistencies and question marks arising from utility ESG reports.
For example, some utilities reported scope 3 emissions as business travel only, without including other value chain emissions. Others included future energy mixes that weren’t separated by fuel and instead grouped into “renewable” and “non-renewable.”
The biggest discrepancies, however, were between what each utility is required to report, as well as what they choose to. That means that metrics like internal energy consumption didn’t need to be reported by the vast majority.
Likewise, some companies didn’t need to report waste generation or emissions because of “minimal hazardous waste generation” that fell under a certain threshold. Other metrics like internal vehicle electrification were only checked if the company decided to make a detailed commitment and unveil its plans.
As pressure for the electricity sector to decarbonize continues to increase at the federal level, however, many of these inconsistencies are roadblocks to clear and direct measurements and reduction strategies.
National Public Utilities Council is the go-to resource for all things decarbonization in the utilities industry. Learn more.
-

 Sponsored3 years ago
More Than Precious: Silver’s Role in the New Energy Era (Part 3 of 3)
Long known as a precious metal, silver in solar and EV technologies will redefine its role and importance to a greener economy.
-
 Sponsored7 years ago
The History and Evolution of the Video Games Market
Everything from Pong to the rise of mobile gaming and AR/VR. Learn about the $100 billion video games market in this giant infographic.
-
 Sponsored8 years ago
The Extraordinary Raw Materials in an iPhone 6s
Over 700 million iPhones have now been sold, but the iPhone would not exist if it were not for the raw materials that make the technology...
-
 Sponsored8 years ago
The Industrial Internet, and How It’s Revolutionizing Mining
The convergence of the global industrial sector with big data and the internet of things, or the Industrial Internet, will revolutionize how mining works.