Chart of the Week
Map: Which Cities Hold Africa’s Wealth?
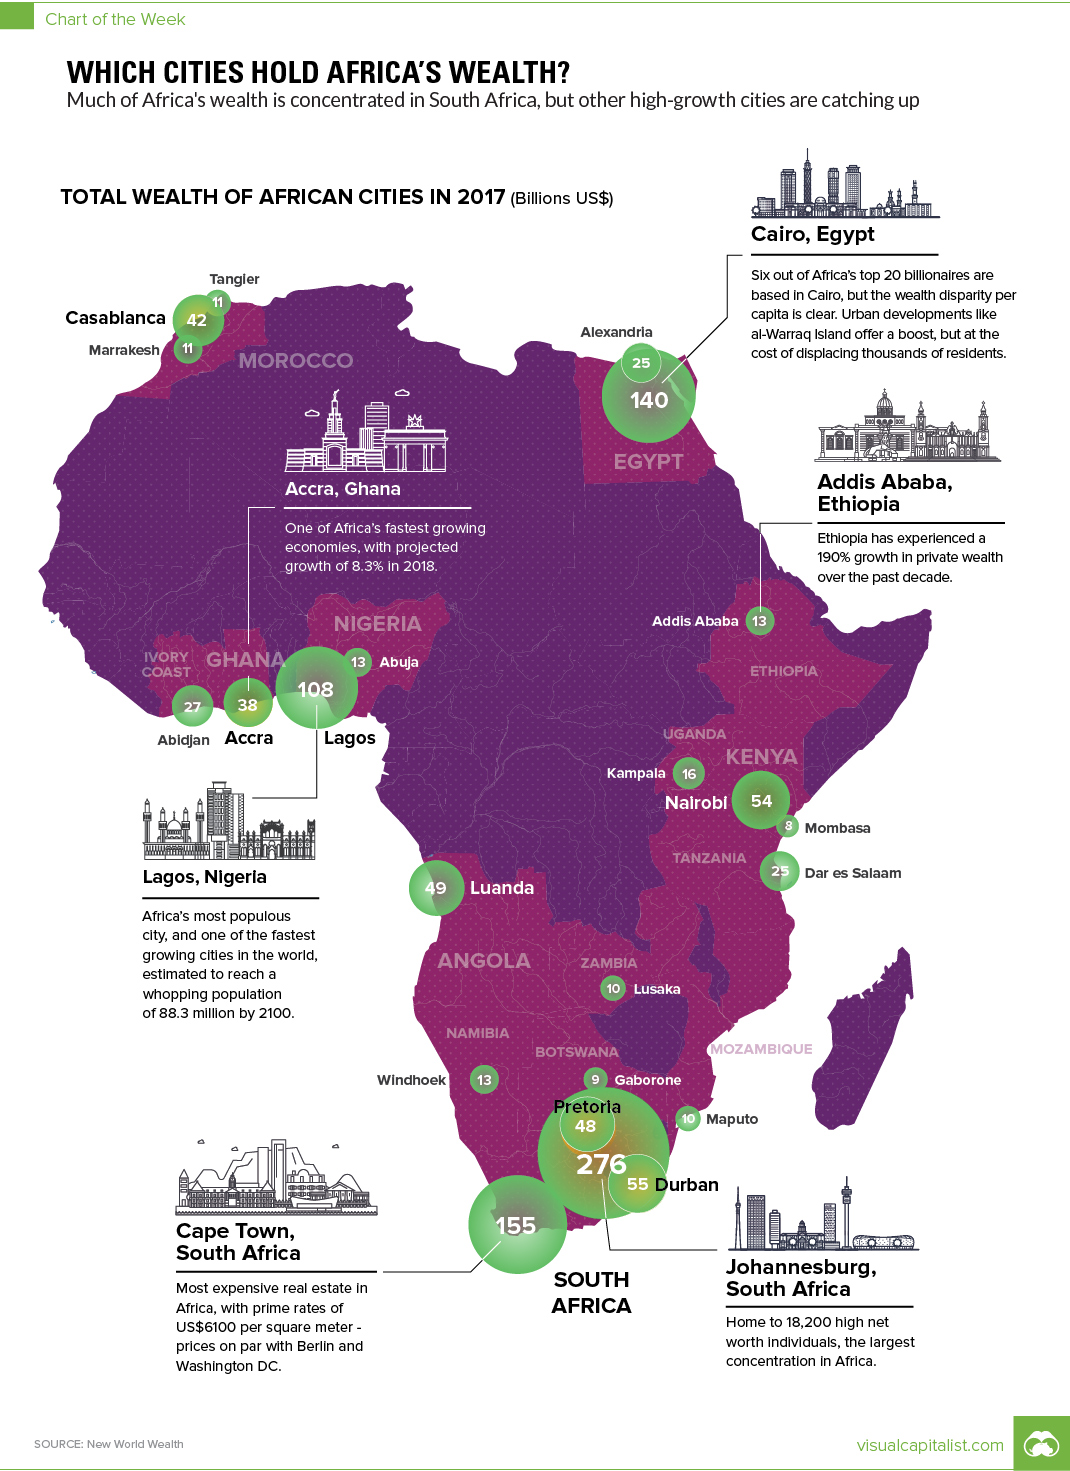
Mapping Africa’s Wealth
The Chart of the Week is a weekly Visual Capitalist feature on Fridays.
The economy in Africa is on the rise, and financial hubs are beginning to emerge.
While the resource-rich African continent has seen only 13% growth in total private wealth over the past 10 years, the 3% spike in the past year alone indicates the growth is just warming up. Africa will also be home to 13 out of the 20 of the world’s largest megacities by 2100.
In this week’s chart, we take a look at Africa’s wealthiest cities, courtesy of this recent 2018 report from New World Wealth and AfrAsia Bank.
Africa’s Evolving Economy
While Africa has traditionally played a minor role in the world market, the continent is coming into its own as a hub for financial services and entrepreneurship.
Africa’s growing elite has added 19,000 millionaires over the past decade, with total private wealth totaling $2.3 trillion. These figures are predicted to increase by 34% over the next decade, reaching $3.1 trillion by the end of 2027.
The five wealthiest cities hail from three countries:
1. Johannesburg, South Africa ($276 billion)
Founded in the Witwatersrand Gold Rush of 1886, South Africa’s City of Gold is a hub for financial services, professional services (law firms and consultancies), construction, telecommunications, and basic materials.
2. Cape Town, South Africa ($155 billion)
One of South Africa’s three capital cities, Cape Town’s major sectors include real estate, financial services, retail, and tourism. Cape Town has the highest prime residential rates on the continent at US$6,100 per square meter, similar to cities such as Washington, D.C., or Berlin.
3. Cairo, Egypt ($140 billion)
A hub for Africa and the Middle East, Cairo’s major sectors include real estate, construction, financial services, and basic materials.
4. Lagos, Nigeria ($108 billion)
The clearing house for 80% of Nigeria’s imports, major sectors include basic materials, real estate, construction, telecommunications, transport, and financial services.
5. Durban, South Africa ($55 billion)
Home to the biggest shopping center in Africa – complete with 350 stores, 70 restaurants, 18 movie theaters, an IMAX theater, an indoor climbing wall, and a skate park designed by Tony Hawk – Durban’s major sectors include real estate, finance, healthcare, construction, retail, and transport.
The Full List of Cities
Here is a full ranking of the top 23 cities in Africa, based on New World Wealth’s data.
| Rank | City | Country | Total Private Wealth (USD) |
|---|---|---|---|
| #1 | Johannesburg | South Africa | $276 billion |
| #2 | Cape Town | South Africa | $155 billion |
| #3 | Cairo | Egypt | $140 billion |
| #4 | Lagos | Nigeria | $108 billion |
| #5 | Durban | South Africa | $55 billion |
| #6 | Nairobi | Kenya | $54 billion |
| #7 | Luanda | Angola | $49 billion |
| #8 | Pretoria | South Africa | $48 billion |
| #9 | Casablanca | Morocco | $42 billion |
| #10 | Accra | Ghana | $38 billion |
| #11 | Abidjan | Côte d'Ivoire | $27 billion |
| #12 | Dar es Salaam | Tanzania | $25 billion |
| #13 | Alexandria | Egypt | $25 billion |
| #14 | Kampala | Uganda | $16 billion |
| #15 | Windhoek | Namibia | $13 billion |
| #16 | Abuja | Nigeria | $13 billion |
| #17 | Addis Ababa | Ethiopia | $13 billion |
| #18 | Marrakesh | Morocco | $11 billion |
| #19 | Tangier | Morocco | $11 billion |
| #20 | Lusaka | Zambia | $10 billion |
| #21 | Maputo | Mozambique | $10 billion |
| #22 | Gaborone | Botswana | $9 billion |
| #23 | Mombasa | Kenya | $8 billion |
With a growth trajectory on the rise and renewed interest in African investment, what will Africa’s economy look like ten years from now?
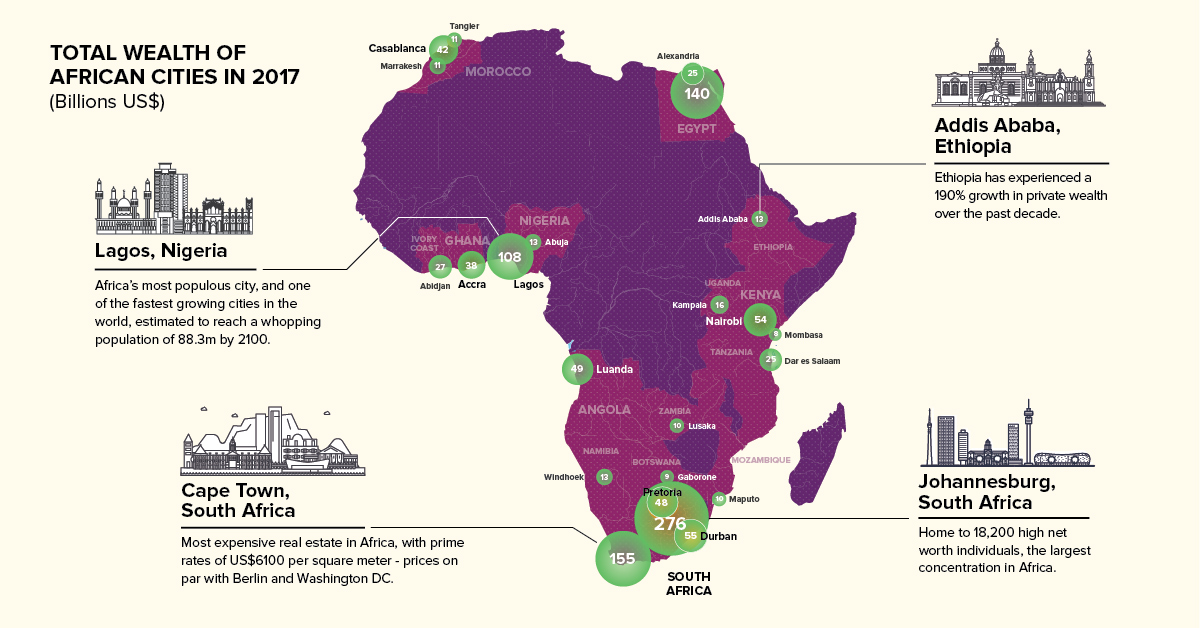


Chart of the Week
The Road to Recovery: Which Economies are Reopening?
We look at mobility rates as well as COVID-19 recovery rates for 41 economies, to see which countries are reopening for business.

The Road to Recovery: Which Economies are Reopening?
COVID-19 has brought the world to a halt—but after months of uncertainty, it seems that the situation is slowly taking a turn for the better.
Today’s chart measures the extent to which 41 major economies are reopening, by plotting two metrics for each country: the mobility rate and the COVID-19 recovery rate:
- Mobility Index
This refers to the change in activity around workplaces, subtracting activity around residences, measured as a percentage deviation from the baseline. - COVID-19 Recovery Rate
The number of recovered cases in a country is measured as the percentage of total cases.
Data for the first measure comes from Google’s COVID-19 Community Mobility Reports, which relies on aggregated, anonymous location history data from individuals. Note that China does not show up in the graphic as the government bans Google services.
COVID-19 recovery rates rely on values from CoronaTracker, using aggregated information from multiple global and governmental databases such as WHO and CDC.
Reopening Economies, One Step at a Time
In general, the higher the mobility rate, the more economic activity this signifies. In most cases, mobility rate also correlates with a higher rate of recovered people in the population.
Here’s how these countries fare based on the above metrics.
| Country | Mobility Rate | Recovery Rate | Total Cases | Total Recovered |
|---|---|---|---|---|
| Argentina | -56% | 31.40% | 14,702 | 4,617 |
| Australia | -41% | 92.03% | 7,150 | 6,580 |
| Austria | -100% | 91.93% | 16,628 | 15,286 |
| Belgium | -105% | 26.92% | 57,849 | 15,572 |
| Brazil | -48% | 44.02% | 438,812 | 193,181 |
| Canada | -67% | 52.91% | 88,512 | 46,831 |
| Chile | -110% | 41.58% | 86,943 | 36,150 |
| Colombia | -73% | 26.28% | 25,366 | 6,665 |
| Czechia | -29% | 70.68% | 9,140 | 6,460 |
| Denmark | -93% | 88.43% | 11,512 | 10,180 |
| Finland | -93% | 81.57% | 6,743 | 5,500 |
| France | -100% | 36.08% | 186,238 | 67,191 |
| Germany | -99% | 89.45% | 182,452 | 163,200 |
| Greece | -32% | 47.28% | 2,906 | 1,374 |
| Hong Kong | -10% | 97.00% | 1,067 | 1,035 |
| Hungary | -49% | 52.31% | 3,816 | 1,996 |
| India | -65% | 42.88% | 165,386 | 70,920 |
| Indonesia | -77% | 25.43% | 24,538 | 6,240 |
| Ireland | -79% | 88.92% | 24,841 | 22,089 |
| Israel | -31% | 87.00% | 16,872 | 14,679 |
| Italy | -52% | 64.99% | 231,732 | 150,604 |
| Japan | -33% | 84.80% | 16,683 | 14,147 |
| Malaysia | -53% | 80.86% | 7,629 | 6,169 |
| Mexico | -69% | 69.70% | 78,023 | 54,383 |
| Netherlands | -97% | 0.01% | 45,950 | 3 |
| New Zealand | -21% | 98.01% | 1,504 | 1,474 |
| Norway | -100% | 91.87% | 8,411 | 7,727 |
| Philippines | -87% | 23.08% | 15,588 | 3,598 |
| Poland | -36% | 46.27% | 22,825 | 10,560 |
| Portugal | -65% | 58.99% | 31,596 | 18,637 |
| Singapore | -105% | 55.02% | 33,249 | 18,294 |
| South Africa | -74% | 52.44% | 27,403 | 14,370 |
| South Korea | -4% | 91.15% | 11,344 | 10,340 |
| Spain | -67% | 69.11% | 284,986 | 196,958 |
| Sweden | -93% | 13.91% | 35,727 | 4,971 |
| Switzerland | -101% | 91.90% | 30,796 | 28,300 |
| Taiwan | 4% | 95.24% | 441 | 420 |
| Thailand | -36% | 96.08% | 3,065 | 2,945 |
| U.S. | -56% | 28.20% | 1,768,346 | 498,720 |
| United Kingdom | -82% | 0.05% | 269,127 | 135 |
| Vietnam | 15% | 85.02% | 327 | 278 |
Mobility data as of May 21, 2020 (Latest available). COVID-19 case data as of May 29, 2020.
In the main scatterplot visualization, we’ve taken things a step further, assigning these countries into four distinct quadrants:
1. High Mobility, High Recovery
High recovery rates are resulting in lifted restrictions for countries in this quadrant, and people are steadily returning to work.
New Zealand has earned praise for its early and effective pandemic response, allowing it to curtail the total number of cases. This has resulted in a 98% recovery rate, the highest of all countries. After almost 50 days of lockdown, the government is recommending a flexible four-day work week to boost the economy back up.
2. High Mobility, Low Recovery
Despite low COVID-19 related recoveries, mobility rates of countries in this quadrant remain higher than average. Some countries have loosened lockdown measures, while others did not have strict measures in place to begin with.
Brazil is an interesting case study to consider here. After deferring lockdown decisions to state and local levels, the country is now averaging the highest number of daily cases out of any country. On May 28th, for example, the country had 24,151 new cases and 1,067 new deaths.
3. Low Mobility, High Recovery
Countries in this quadrant are playing it safe, and holding off on reopening their economies until the population has fully recovered.
Italy, the once-epicenter for the crisis in Europe is understandably wary of cases rising back up to critical levels. As a result, it has opted to keep its activity to a minimum to try and boost the 65% recovery rate, even as it slowly emerges from over 10 weeks of lockdown.
4. Low Mobility, Low Recovery
Last but not least, people in these countries are cautiously remaining indoors as their governments continue to work on crisis response.
With a low 0.05% recovery rate, the United Kingdom has no immediate plans to reopen. A two-week lag time in reporting discharged patients from NHS services may also be contributing to this low number. Although new cases are leveling off, the country has the highest coronavirus-caused death toll across Europe.
The U.S. also sits in this quadrant with over 1.7 million cases and counting. Recently, some states have opted to ease restrictions on social and business activity, which could potentially result in case numbers climbing back up.
Over in Sweden, a controversial herd immunity strategy meant that the country continued business as usual amid the rest of Europe’s heightened regulations. Sweden’s COVID-19 recovery rate sits at only 13.9%, and the country’s -93% mobility rate implies that people have been taking their own precautions.
COVID-19’s Impact on the Future
It’s important to note that a “second wave” of new cases could upend plans to reopen economies. As countries reckon with these competing risks of health and economic activity, there is no clear answer around the right path to take.
COVID-19 is a catalyst for an entirely different future, but interestingly, it’s one that has been in the works for a while.
Without being melodramatic, COVID-19 is like the last nail in the coffin of globalization…The 2008-2009 crisis gave globalization a big hit, as did Brexit, as did the U.S.-China trade war, but COVID is taking it to a new level.
—Carmen Reinhart, incoming Chief Economist for the World Bank
Will there be any chance of returning to “normal” as we know it?

-

 Science1 week ago
Visualizing the Average Lifespans of Mammals
-

 Markets2 weeks ago
The Top 10 States by Real GDP Growth in 2023
-

 Demographics2 weeks ago
The Smallest Gender Wage Gaps in OECD Countries
-

 United States2 weeks ago
Where U.S. Inflation Hit the Hardest in March 2024
-

 Green2 weeks ago
Top Countries By Forest Growth Since 2001
-

 United States2 weeks ago
Ranked: The Largest U.S. Corporations by Number of Employees
-

 Maps2 weeks ago
The Largest Earthquakes in the New York Area (1970-2024)
-

 Green2 weeks ago
Ranked: The Countries With the Most Air Pollution in 2023