Markets
How the World’s Biggest Companies Have Changed in Just 10 Years
How the World’s Biggest Companies Have Changed in Just 10 Years
The Chart of the Week is a weekly Visual Capitalist feature on Fridays.
At first glance, the business world may seem quite static. The biggest companies today – ones like Apple, Walmart, or Exxon Mobil – will likely also be some of the biggest companies tomorrow. Fast forward a week, a month, or a year, and odds are that they will still be at the top of the food chain.
But fast forward any further, and those odds change considerably. In a decade, there just has to be one bad strategic decision, a missed trend, or a colossal managerial mistake, and you have the next Kodak, Blockbuster, or Sears.
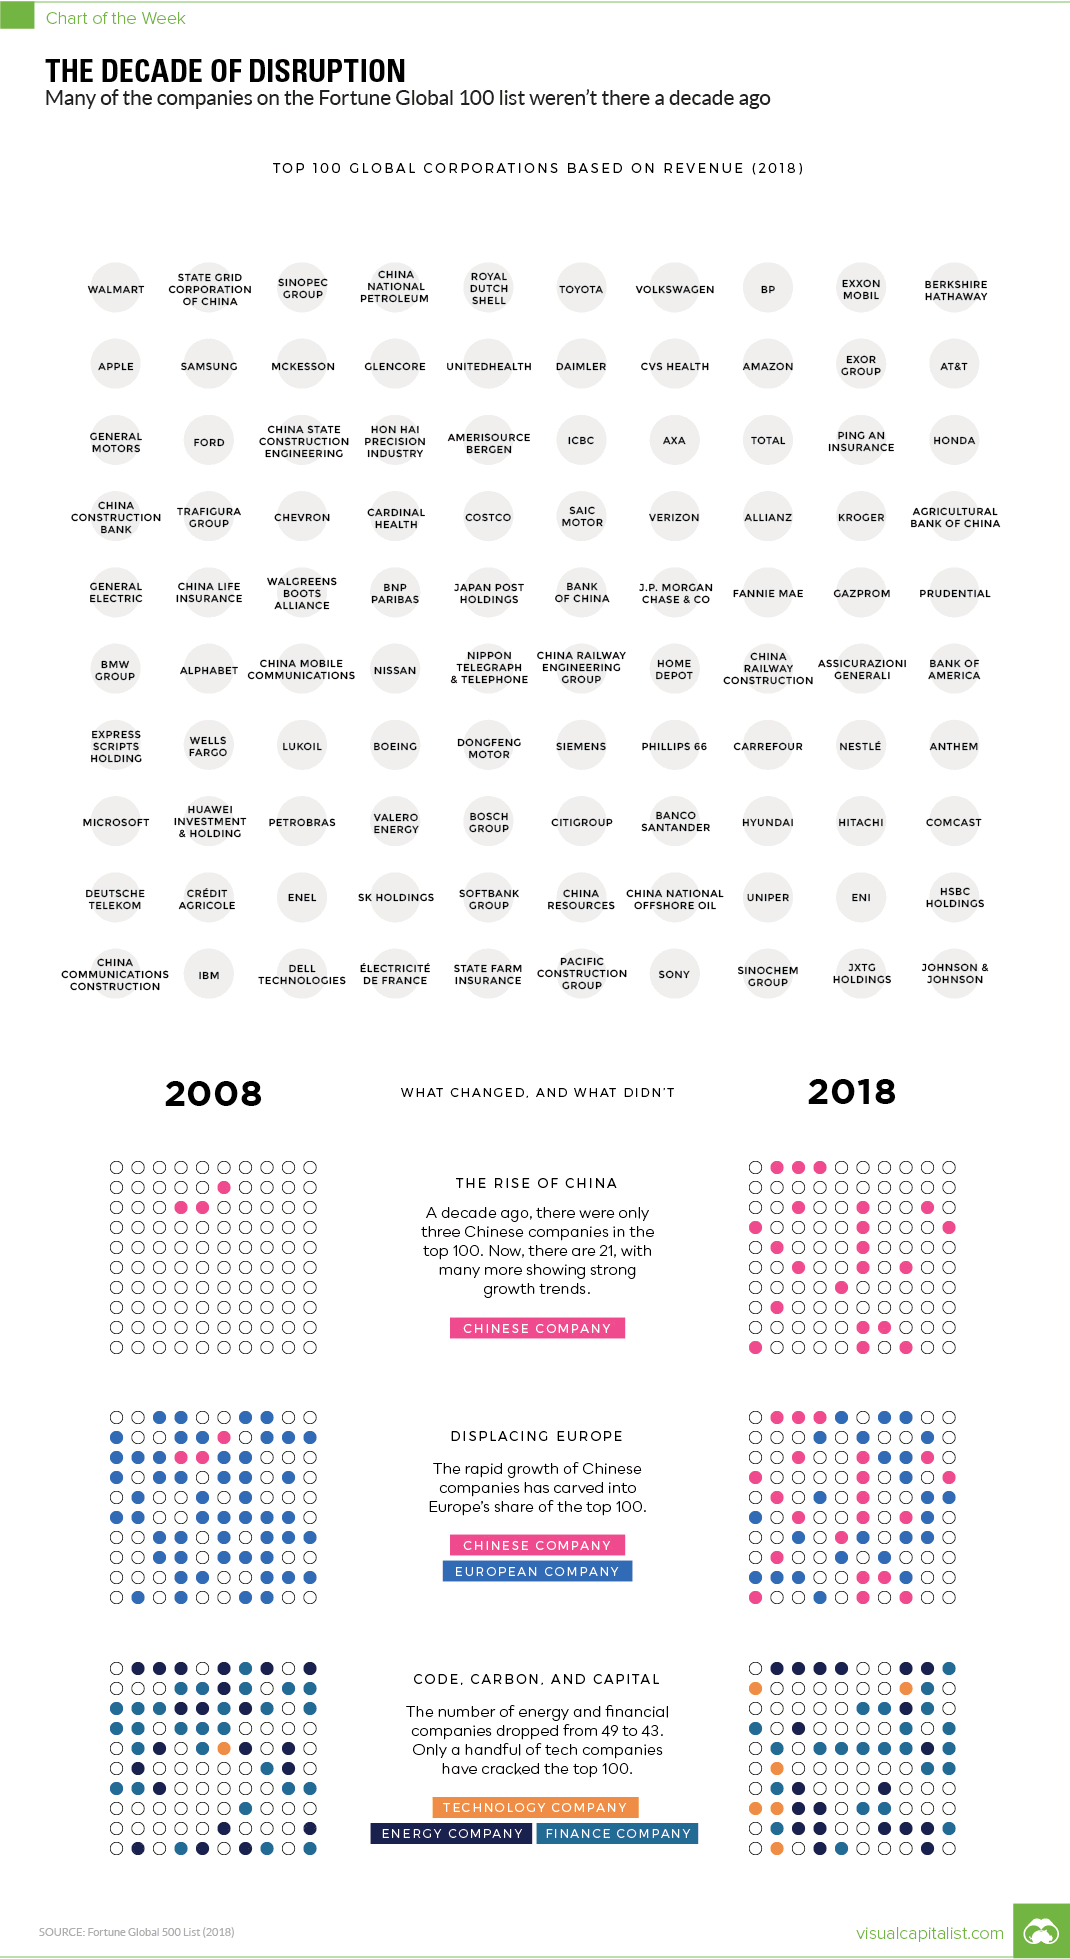
A Changing List
Every year, Fortune publishes a ranking of the world’s top companies by revenue. We compared the 100 highest revenue companies in both 2008 and 2018 to see how much things change in ten years – and the results are pretty astounding.
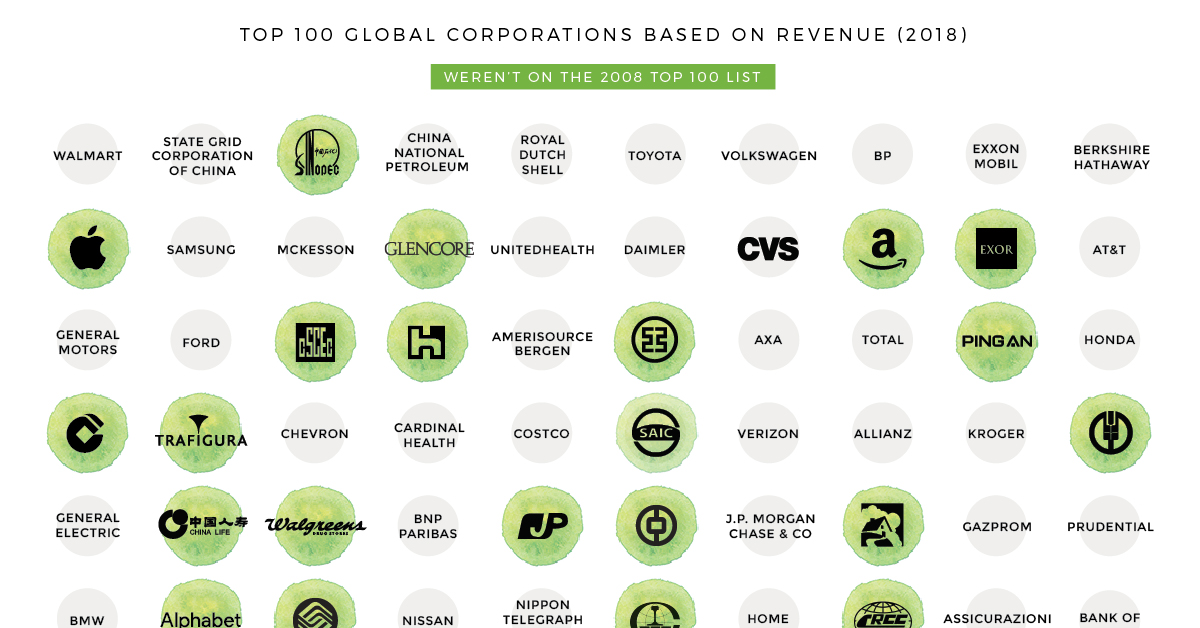
The most fundamental finding: 43 of the 100 companies on top of today’s list were not there ten years ago. Some of the “new” entries, like Amazon or Huawei, are to be expected – but other companies like Microsoft or Apple are more surprising.
In 2008, for example, Apple was ranked just #337 in global revenue, and today it comes in 11th place.
A Closer Look at the Top 10
The full graphic looks at the Top 100, but let’s zoom in just to the very top.
Here were the top 10 companies in 2008:
| Rank (2008) | Company | Country | Revenue |
|---|---|---|---|
| #1 | Walmart | USA | $378.8 billion |
| #2 | Exxon Mobil | USA | $372.8 billion |
| #3 | Royal Dutch Shell | Netherlands | $355.8 billion |
| #4 | BP | UK | $291.4 billion |
| #5 | Toyota Motor | Japan | $230.2 billion |
| #6 | Chevron | USA | $210.8 billion |
| #7 | ING Group | Netherlands | $201.5 billion |
| #8 | Total | France | $187.3 billion |
| #9 | General Motors | USA | $182.3 billion |
| #10 | ConocoPhillips | USA | $178.6 billion |
Ten years ago, oil prices were sky-high and the list was dominated with energy names like Total, Chevron, and ConocoPhillips. Amazingly, ING Group was the only financial company to make the list in 2008, but it has since fallen to #171 globally.
Let’s jump to the 2018 list:
| Rank (2018) | Company | Country | Revenue |
|---|---|---|---|
| #1 | Walmart | USA | $500.3 billion |
| #2 | State Grid | China | $348.9 billion |
| #3 | Sinopec Group | China | $327.0 billion |
| #4 | China National Petroleum | China | $326.0 billion |
| #5 | Royal Dutch Shell | Netherlands | $311.9 billion |
| #6 | Toyota Motor | Japan | $265.2 billion |
| #7 | Volkswagen | Germany | $260.0 billion |
| #8 | BP | UK | $244.6 billion |
| #9 | Exxon Mobil | USA | $244.4 billion |
| #10 | Berkshire Hathaway | USA | $242.1 billion |
While the modern list has just as many energy names, half of them are now Chinese companies like State Grid or Sinopec Group. Meanwhile, the staying power – at least in terms of revenue – of companies like Walmart, Toyota, Royal Dutch Shell, and BP is quite impressive.


Markets
The European Stock Market: Attractive Valuations Offer Opportunities
On average, the European stock market has valuations that are nearly 50% lower than U.S. valuations. But how can you access the market?


European Stock Market: Attractive Valuations Offer Opportunities
Europe is known for some established brands, from L’Oréal to Louis Vuitton. However, the European stock market offers additional opportunities that may be lesser known.
The above infographic, sponsored by STOXX, outlines why investors may want to consider European stocks.
Attractive Valuations
Compared to most North American and Asian markets, European stocks offer lower or comparable valuations.
| Index | Price-to-Earnings Ratio | Price-to-Book Ratio |
|---|---|---|
| EURO STOXX 50 | 14.9 | 2.2 |
| STOXX Europe 600 | 14.4 | 2 |
| U.S. | 25.9 | 4.7 |
| Canada | 16.1 | 1.8 |
| Japan | 15.4 | 1.6 |
| Asia Pacific ex. China | 17.1 | 1.8 |
Data as of February 29, 2024. See graphic for full index names. Ratios based on trailing 12 month financials. The price to earnings ratio excludes companies with negative earnings.
On average, European valuations are nearly 50% lower than U.S. valuations, potentially offering an affordable entry point for investors.
Research also shows that lower price ratios have historically led to higher long-term returns.
Market Movements Not Closely Connected
Over the last decade, the European stock market had low-to-moderate correlation with North American and Asian equities.
The below chart shows correlations from February 2014 to February 2024. A value closer to zero indicates low correlation, while a value of one would indicate that two regions are moving in perfect unison.
| EURO STOXX 50 | STOXX EUROPE 600 | U.S. | Canada | Japan | Asia Pacific ex. China |
|
|---|---|---|---|---|---|---|
| EURO STOXX 50 | 1.00 | 0.97 | 0.55 | 0.67 | 0.24 | 0.43 |
| STOXX EUROPE 600 | 1.00 | 0.56 | 0.71 | 0.28 | 0.48 | |
| U.S. | 1.00 | 0.73 | 0.12 | 0.25 | ||
| Canada | 1.00 | 0.22 | 0.40 | |||
| Japan | 1.00 | 0.88 | ||||
| Asia Pacific ex. China | 1.00 |
Data is based on daily USD returns.
European equities had relatively independent market movements from North American and Asian markets. One contributing factor could be the differing sector weights in each market. For instance, technology makes up a quarter of the U.S. market, but health care and industrials dominate the broader European market.
Ultimately, European equities can enhance portfolio diversification and have the potential to mitigate risk for investors.
Tracking the Market
For investors interested in European equities, STOXX offers a variety of flagship indices:
| Index | Description | Market Cap |
|---|---|---|
| STOXX Europe 600 | Pan-regional, broad market | €10.5T |
| STOXX Developed Europe | Pan-regional, broad-market | €9.9T |
| STOXX Europe 600 ESG-X | Pan-regional, broad market, sustainability focus | €9.7T |
| STOXX Europe 50 | Pan-regional, blue-chip | €5.1T |
| EURO STOXX 50 | Eurozone, blue-chip | €3.5T |
Data is as of February 29, 2024. Market cap is free float, which represents the shares that are readily available for public trading on stock exchanges.
The EURO STOXX 50 tracks the Eurozone’s biggest and most traded companies. It also underlies one of the world’s largest ranges of ETFs and mutual funds. As of November 2023, there were €27.3 billion in ETFs and €23.5B in mutual fund assets under management tracking the index.
“For the past 25 years, the EURO STOXX 50 has served as an accurate, reliable and tradable representation of the Eurozone equity market.”
— Axel Lomholt, General Manager at STOXX
Partnering with STOXX to Track the European Stock Market
Are you interested in European equities? STOXX can be a valuable partner:
- Comprehensive, liquid and investable ecosystem
- European heritage, global reach
- Highly sophisticated customization capabilities
- Open architecture approach to using data
- Close partnerships with clients
- Part of ISS STOXX and Deutsche Börse Group
With a full suite of indices, STOXX can help you benchmark against the European stock market.
Learn how STOXX’s European indices offer liquid and effective market access.

-

 Economy4 days ago
Economic Growth Forecasts for G7 and BRICS Countries in 2024
The IMF has released its economic growth forecasts for 2024. How do the G7 and BRICS countries compare?
-

 Markets2 weeks ago
U.S. Debt Interest Payments Reach $1 Trillion
U.S. debt interest payments have surged past the $1 trillion dollar mark, amid high interest rates and an ever-expanding debt burden.
-

 United States2 weeks ago
Ranked: The Largest U.S. Corporations by Number of Employees
We visualized the top U.S. companies by employees, revealing the massive scale of retailers like Walmart, Target, and Home Depot.
-

 Markets2 weeks ago
The Top 10 States by Real GDP Growth in 2023
This graphic shows the states with the highest real GDP growth rate in 2023, largely propelled by the oil and gas boom.
-

 Markets3 weeks ago
Ranked: The World’s Top Flight Routes, by Revenue
In this graphic, we show the highest earning flight routes globally as air travel continued to rebound in 2023.
-

 Markets3 weeks ago
Ranked: The Most Valuable Housing Markets in America
The U.S. residential real estate market is worth a staggering $47.5 trillion. Here are the most valuable housing markets in the country.


-

 Science1 week ago
Visualizing the Average Lifespans of Mammals
-

 Demographics2 weeks ago
The Smallest Gender Wage Gaps in OECD Countries
-

 United States2 weeks ago
Where U.S. Inflation Hit the Hardest in March 2024
-

 Green2 weeks ago
Top Countries By Forest Growth Since 2001
-
United States2 weeks ago
Ranked: The Largest U.S. Corporations by Number of Employees
-

 Maps2 weeks ago
The Largest Earthquakes in the New York Area (1970-2024)
-

 Green2 weeks ago
Ranked: The Countries With the Most Air Pollution in 2023
-

 Green2 weeks ago
Ranking the Top 15 Countries by Carbon Tax Revenue