Markets
Chart: Where is Global Growth Happening?
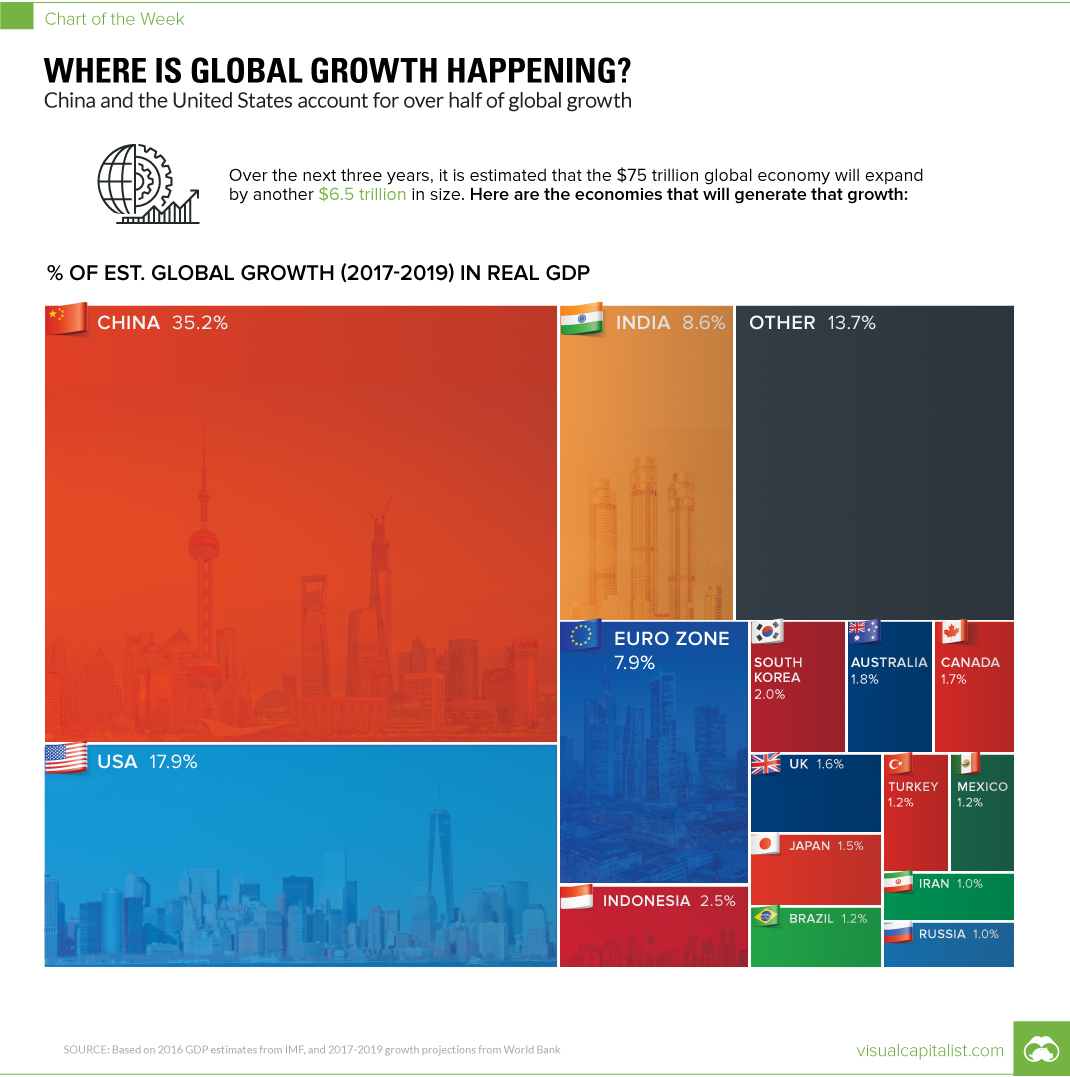
Chart: Where is Global Growth Happening?
China and U.S. still generating >50% of Real GDP growth
The Chart of the Week is a weekly Visual Capitalist feature on Fridays.
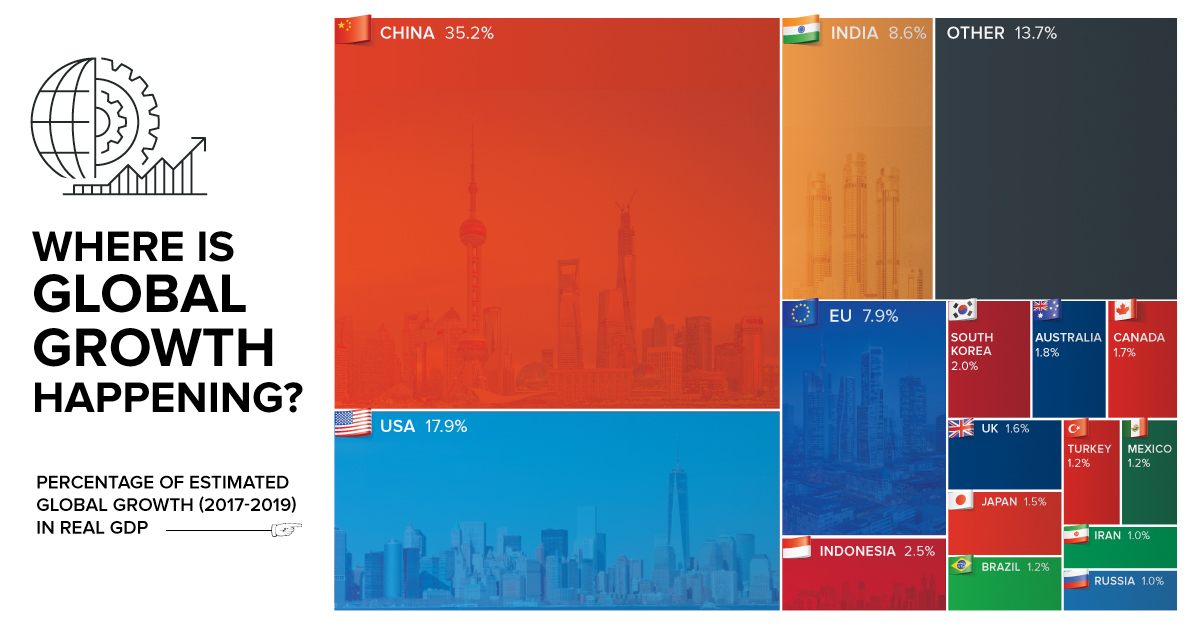
According to forecasts from earlier this year by the World Bank, the global economy is expected to average a Real GDP growth rate of 2.8% between 2017-2019.
But where will this growth actually happen? Is it in giant countries that are growing at a stable 2% clip, or is it occurring in the smaller emerging markets where 8% growth is not uncommon?
Today’s chart looks at individual countries between 2017-2019, based on their individual growth projections from the World Bank, to see where new wealth is being created.
China Still Tops
Even though growth has slowed in China somewhat, the World Bank still estimates its economy to expand at a 6.5% clip this year, and 6.3% in both 2018 and 2019.
Add these numbers onto the world’s second biggest economy (and the biggest in PPP terms), and you have an incredible amount of growth. In fact, about 35.2% of global GDP growth will come from China over this period of time, putting the country’s economic output $2.3 trillion higher.
Uncertainty in the U.S.
While the U.S. is also expected to contribute a significant portion of global growth, the World Bank had a fairly ominous caveat to their projections over coming years.
The U.S. forecasts do not incorporate the effect of policy proposals by the new U.S. administration, as their overall scope and ultimate form are still uncertain.
– World Bank, Global Outlook Summary
That said, the World Bank does also mention that the tax cuts proposed by the Trump administration could theoretically bump up U.S. and global growth if implemented. However, with all of the chaos in the current U.S. political environment, the tax cuts have been delayed for now – and some analysts are scaling back the chances of them even happening at all.
Other Growth Hotbeds
Beyond the usual suspects of China, India, the Eurozone, and the U.S., it is interesting to see Indonesia as the next biggest bright spot using this type of analysis.
In fact, the world’s fourth most populous nation will account for 2.5% of global GDP growth over the aforementioned time period, adding another $160 billion to its $941 billion GDP. The World Bank projects growth for the country at 5.3% this year, and 5.5% for the next two years.
The other countries that registered as providing 1% or more of global growth?
They include: South Korea (2.0%), Australia (1.8%), Canada (1.7%), UK (1.6%), Japan (1.5%), Brazil (1.2%), Turkey (1.2%), Mexico (1.2%), Russia (1.0%), and Iran (1.0%).
–
Correction: A previous version of the chart was incorrectly labeled “EU”. That portion of the tree map has been updated to Euro Zone.


Markets
Mapped: Europe’s GDP Per Capita, by Country
Which European economies are richest on a GDP per capita basis? This map shows the results for 44 countries across the continent.


Mapped: Europe’s GDP Per Capita, by Country (2024)
This was originally posted on our Voronoi app. Download the app for free on iOS or Android and discover incredible data-driven charts from a variety of trusted sources.
Europe is home to some of the largest and most sophisticated economies in the world. But how do countries in the region compare with each other on a per capita productivity basis?
In this map, we show Europe’s GDP per capita levels across 44 nations in current U.S. dollars. Data for this visualization and article is sourced from the International Monetary Fund (IMF) via their DataMapper tool, updated April 2024.
Europe’s Richest and Poorest Nations, By GDP Per Capita
Luxembourg, Ireland, and Switzerland, lead the list of Europe’s richest nations by GDP per capita, all above $100,000.
| Rank | Country | GDP Per Capita (2024) |
|---|---|---|
| 1 | 🇱🇺 Luxembourg | $131,380 |
| 2 | 🇮🇪 Ireland | $106,060 |
| 3 | 🇨🇭 Switzerland | $105,670 |
| 4 | 🇳🇴 Norway | $94,660 |
| 5 | 🇮🇸 Iceland | $84,590 |
| 6 | 🇩🇰 Denmark | $68,900 |
| 7 | 🇳🇱 Netherlands | $63,750 |
| 8 | 🇸🇲 San Marino | $59,410 |
| 9 | 🇦🇹 Austria | $59,230 |
| 10 | 🇸🇪 Sweden | $58,530 |
| 11 | 🇧🇪 Belgium | $55,540 |
| 12 | 🇫🇮 Finland | $55,130 |
| 13 | 🇩🇪 Germany | $54,290 |
| 14 | 🇬🇧 UK | $51,070 |
| 15 | 🇫🇷 France | $47,360 |
| 16 | 🇦🇩 Andorra | $44,900 |
| 17 | 🇲🇹 Malta | $41,740 |
| 18 | 🇮🇹 Italy | $39,580 |
| 19 | 🇨🇾 Cyprus | $37,150 |
| 20 | 🇪🇸 Spain | $34,050 |
| 21 | 🇸🇮 Slovenia | $34,030 |
| 22 | 🇪🇪 Estonia | $31,850 |
| 23 | 🇨🇿 Czech Republic | $29,800 |
| 24 | 🇵🇹 Portugal | $28,970 |
| 25 | 🇱🇹 Lithuania | $28,410 |
| 26 | 🇸🇰 Slovakia | $25,930 |
| 27 | 🇱🇻 Latvia | $24,190 |
| 28 | 🇬🇷 Greece | $23,970 |
| 29 | 🇭🇺 Hungary | $23,320 |
| 30 | 🇵🇱 Poland | $23,010 |
| 31 | 🇭🇷 Croatia | $22,970 |
| 32 | 🇷🇴 Romania | $19,530 |
| 33 | 🇧🇬 Bulgaria | $16,940 |
| 34 | 🇷🇺 Russia | $14,390 |
| 35 | 🇹🇷 Türkiye | $12,760 |
| 36 | 🇲🇪 Montenegro | $12,650 |
| 37 | 🇷🇸 Serbia | $12,380 |
| 38 | 🇦🇱 Albania | $8,920 |
| 39 | 🇧🇦 Bosnia & Herzegovina | $8,420 |
| 40 | 🇲🇰 North Macedonia | $7,690 |
| 41 | 🇧🇾 Belarus | $7,560 |
| 42 | 🇲🇩 Moldova | $7,490 |
| 43 | 🇽🇰 Kosovo | $6,390 |
| 44 | 🇺🇦 Ukraine | $5,660 |
| N/A | 🇪🇺 EU Average | $44,200 |
Note: Figures are rounded.
Three Nordic countries (Norway, Iceland, Denmark) also place highly, between $70,000-90,000. Other Nordic peers, Sweden and Finland rank just outside the top 10, between $55,000-60,000.
Meanwhile, Europe’s biggest economies in absolute terms, Germany, UK, and France, rank closer to the middle of the top 20, with GDP per capitas around $50,000.
Finally, at the end of the scale, Eastern Europe as a whole tends to have much lower per capita GDPs. In that group, Ukraine ranks last, at $5,660.
A Closer Look at Ukraine
For a broader comparison, Ukraine’s per capita GDP is similar to Iran ($5,310), El Salvador ($5,540), and Guatemala ($5,680).
According to experts, Ukraine’s economy has historically underperformed to expectations. After the fall of the Berlin Wall, the economy contracted for five straight years. Its transition to a Western, liberalized economic structure was overshadowed by widespread corruption, a limited taxpool, and few revenue sources.
Politically, its transformation from authoritarian regime to civil democracy has proved difficult, especially when it comes to institution building.
Finally, after the 2022 invasion of the country, Ukraine’s GDP contracted by 30% in a single year—the largest loss since independence. Large scale emigration—to the tune of six million refugees—is also playing a role.
Despite these challenges, the country’s economic growth has somewhat stabilized while fighting continues.

-

 Markets6 days ago
Visualized: Interest Rate Forecasts for Advanced Economies
-

 Economy2 weeks ago
Economic Growth Forecasts for G7 and BRICS Countries in 2024
-

 Wealth2 weeks ago
Charted: Which City Has the Most Billionaires in 2024?
-

 Technology2 weeks ago
All of the Grants Given by the U.S. CHIPS Act
-

 Green2 weeks ago
The Carbon Footprint of Major Travel Methods
-

 United States1 week ago
Visualizing the Most Common Pets in the U.S.
-

 Culture1 week ago
The World’s Top Media Franchises by All-Time Revenue
-

 Best of1 week ago
Best Visualizations of April on the Voronoi App