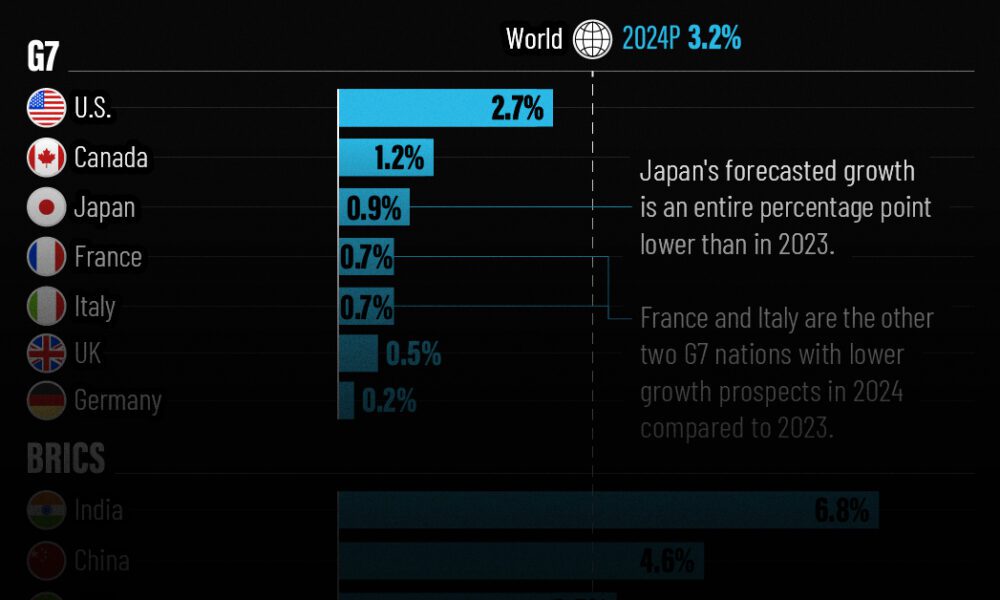
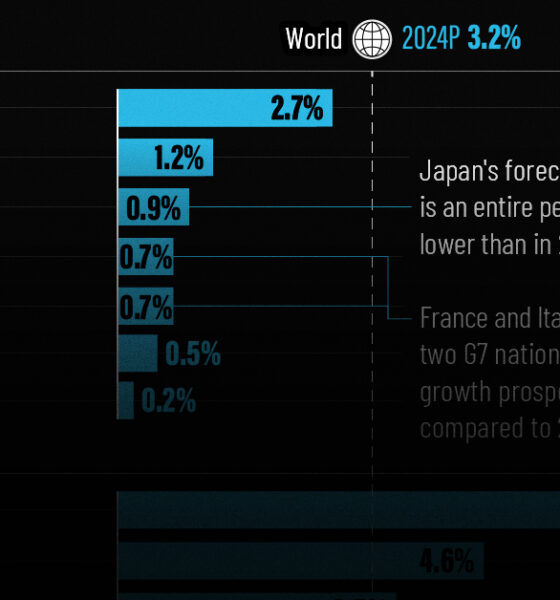
The IMF has released its economic growth forecasts for 2024. How do the G7 and BRICS countries compare?
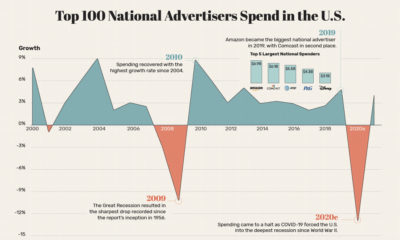

This graphic visualizes the fluctuations in advertising spend in the U.S., along with its brutal decline of 13% as a result of COVID-19.
Here’s a look at the different parts of Amazon’s revenue model, and how much money each business segment makes.
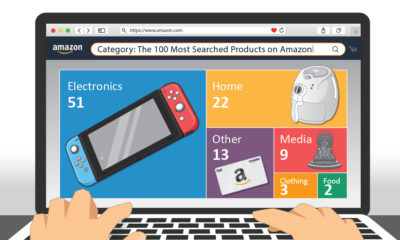

This graphic highlights the top product searches on Amazon in the U.S., providing a glimpse of what items American consumers are after.
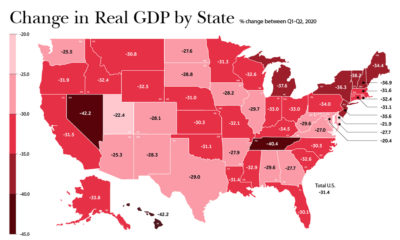

In just a few months, the U.S. economy reeled from COVID-19. As real change in GDP suffered, which states and industries were the hardest-hit?


The Dow Jones Industrial Average is constantly evolving. This chart tracks which companies have come and gone since the inception of the index in 1928.
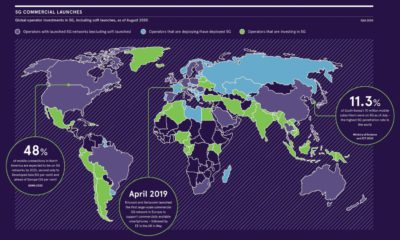

5G networks are at a tipping point. Where are we on the roadmap towards mainstream adoption, and which regions are leading the way?


This infographic delves into five major forces reshaping our world and the new rules of leadership that CEOs should follow as a result.
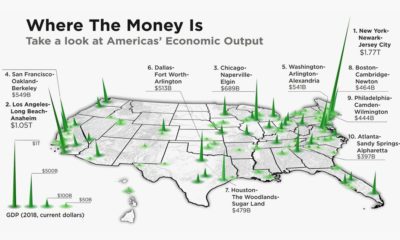

The total U.S. GDP stands at a whopping $21 trillion, but which metro areas contribute to the most in terms of economic output?
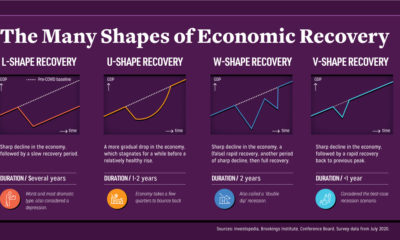

Economic recovery from COVID-19 could come in four shapes—L, U, W, and V. What do they mean, and what do global CEOs see as the most...
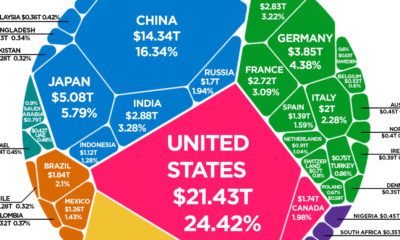

The world's total GDP crested $88 trillion in 2019—but how are the current COVID-19 economic contractions affecting its future outlook?


