Markets
35 Chinese Cities With Economies as Big as Countries
35 Chinese Cities With Economies As Big as Countries
The Chart of the Week is a weekly Visual Capitalist feature on Fridays.
Gaining perspective on China’s monstrous economy isn’t always the easiest thing to do.
With 1.4 billion people and the third-largest geographical area, the country is a vast place to begin with. Add in explosive economic growth, a market-oriented but Communist government, a longstanding and complex cultural history, and self-inflicted demographic challenges – and understanding China can be even more of a puzzle.
City by City
To truly grasp the emergence of China, one approach is to look at the impressive economic footprint made by the country’s cities.
Of course, cities like Shanghai, Beijing, and Hong Kong are the metro economic powerhouses that most people are familiar with. But have you heard of cities like Shijiazhuang, Wuxi, Changsha, Suzhou, Ningbo, Foshan, or Yantai?
There are literally dozens of Chinese cities that most people in Western countries have never heard of – yet they each hold millions of people and have an economic output comparable to nations.
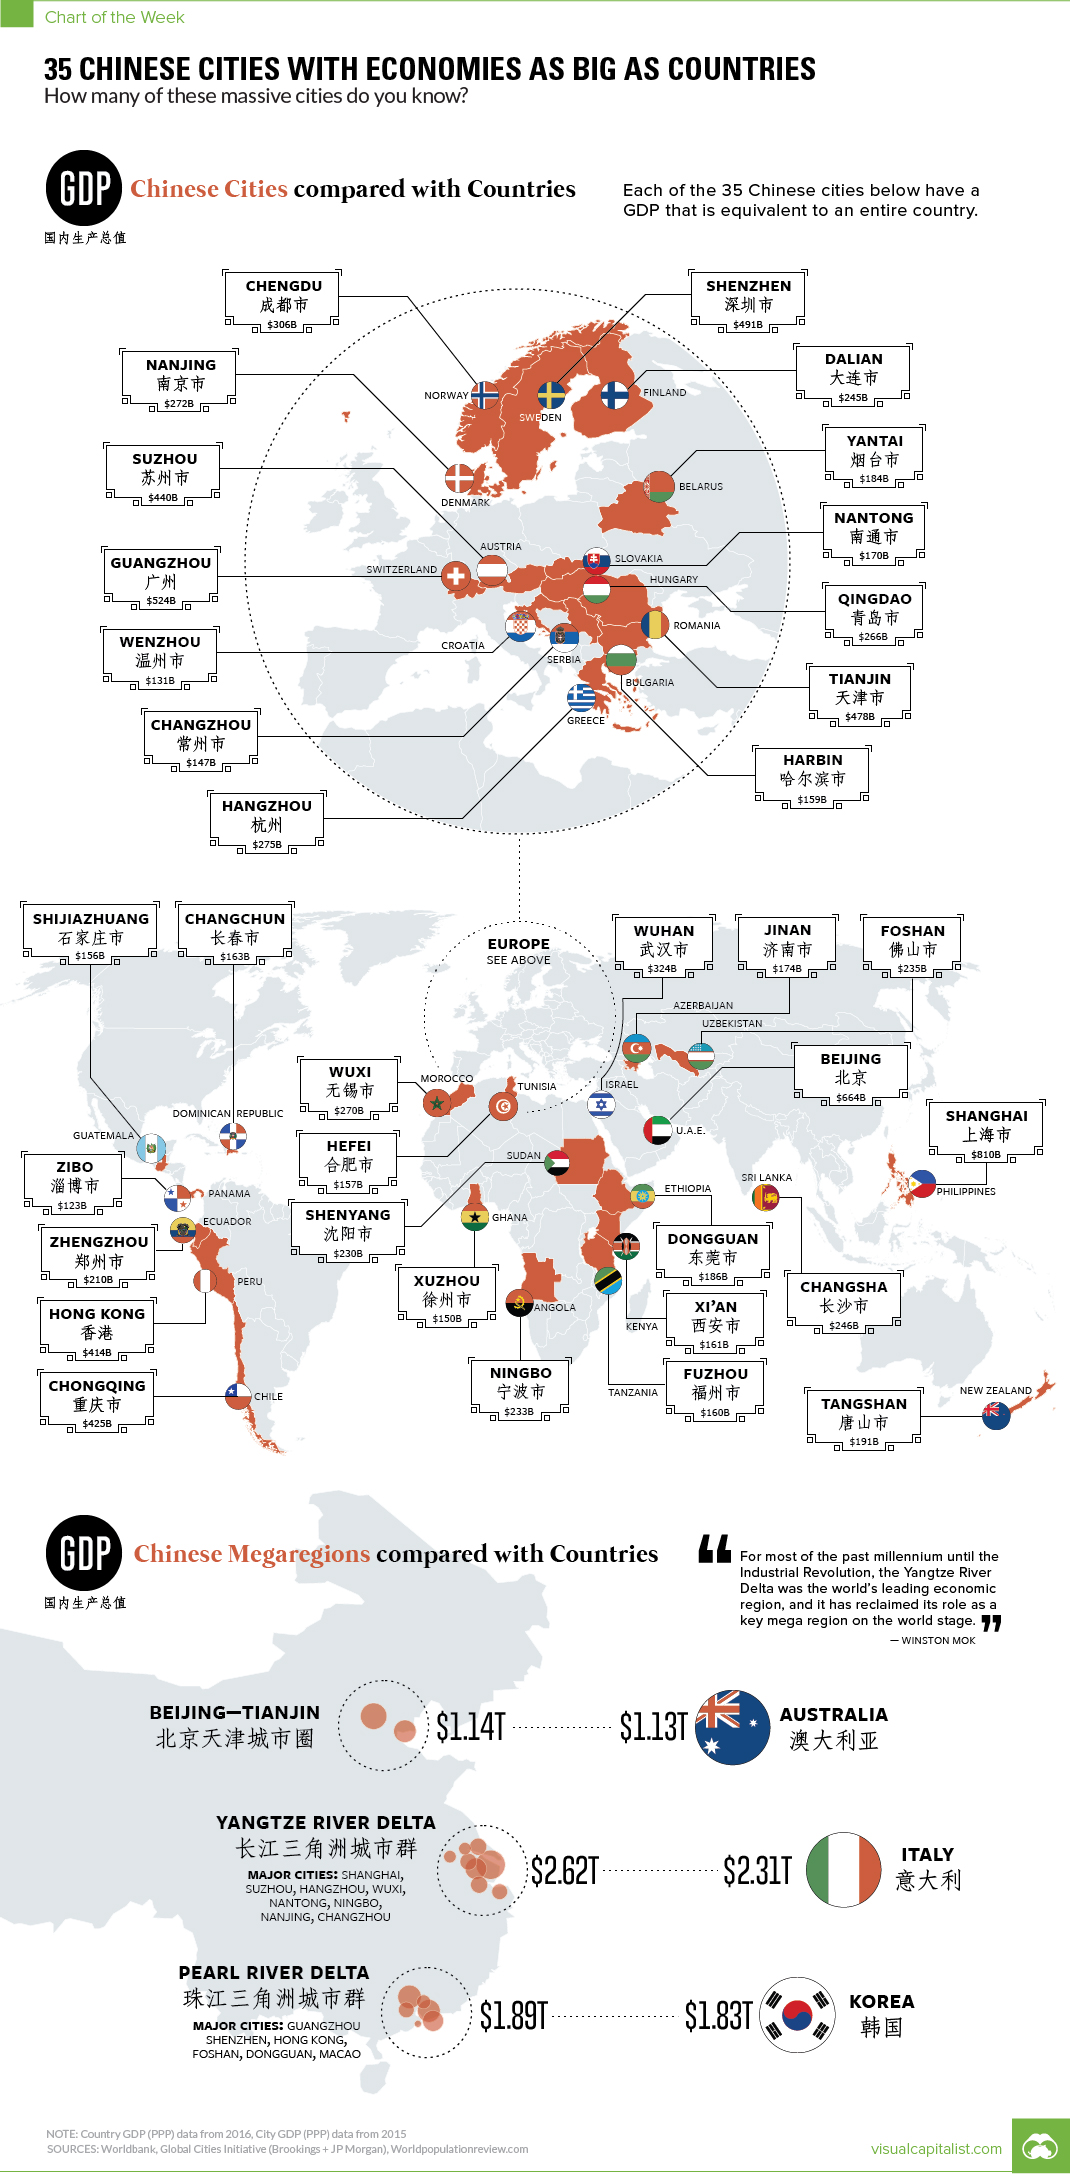
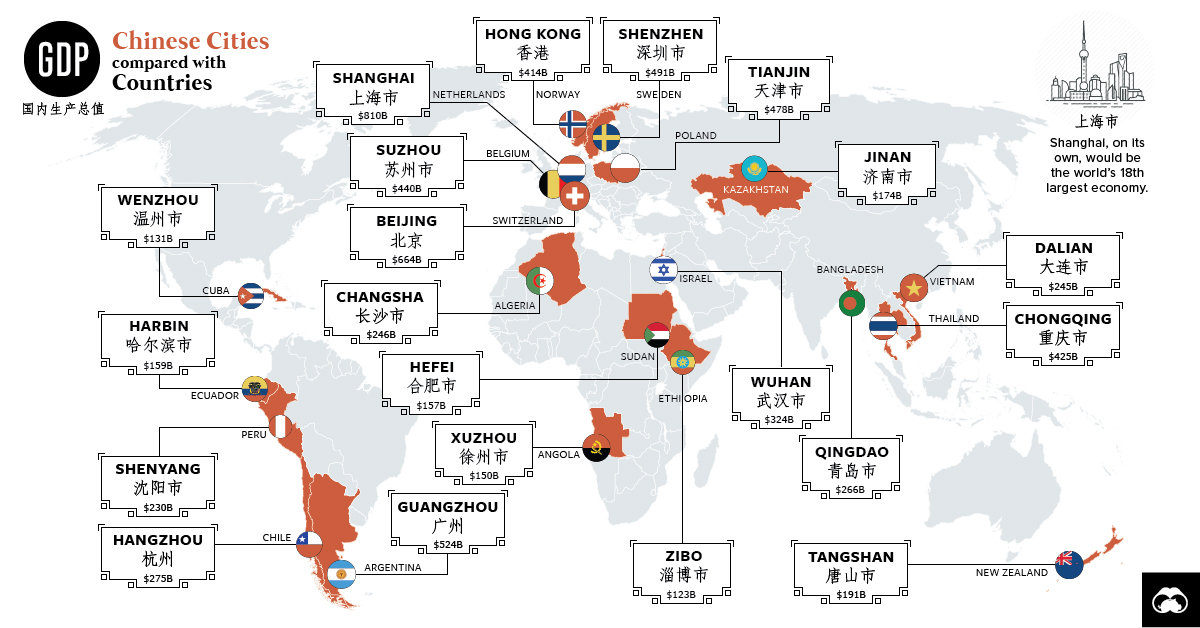
Here’s a list of 35 of them, the size of their local economy, and a comparably sized national economy:
| Rank | Chinese City | City GDP (2015, PPP, in billions) | Comparable Country |
|---|---|---|---|
| #1 | Shanghai | $810 | Philippines |
| #2 | Beijing | $664 | U.A.E. |
| #3 | Guangzhou | $524 | Switzerland |
| #4 | Shenzhen | $491 | Sweden |
| #5 | Tianjin | $478 | Romania |
| #6 | Suzhou | $440 | Austria |
| #7 | Chongqing | $425 | Chile |
| #8 | Hong Kong | $414 | Peru |
| #9 | Wuhan | $324 | Israel |
| #10 | Chengdu | $306 | Norway |
| #11 | Hangzhou | $275 | Greece |
| #12 | Nanjing | $272 | Denmark |
| #13 | Wuxi | $270 | Morocco |
| #14 | Qingdao | $266 | Hungary |
| #15 | Changsha | $246 | Sri Lanka |
| #16 | Dalian | $245 | Finland |
| #17 | Foshan | $235 | Uzbekistan |
| #18 | Ningbo | $233 | Angola |
| #19 | Shenyang | $230 | Sudan |
| #20 | Zhengzhou | $210 | Ecuador |
| #21 | Tangshan | $191 | New Zealand |
| #22 | Dongguan | $186 | Ethiopia |
| #23 | Yantai | $184 | Belarus |
| #24 | Jinan | $174 | Azerbaijan |
| #25 | Nantong | $170 | Slovakia |
| #26 | Changchun | $163 | Dominican Republic |
| #27 | Xi'an | $161 | Kenya |
| #28 | Fuzhou | $160 | Tanzania |
| #29 | Harbin | $159 | Bulgaria |
| #30 | Hefei | $157 | Tunisia |
| #31 | Shijiazhuang | $156 | Guatemala |
| #32 | Xuzhou | $150 | Ghana |
| #33 | Changzhou | $147 | Serbia |
| #34 | Wenzhou | $131 | Croatia |
| #35 | Zibo | $123 | Panama |
Megaregions
It’s also important to remember that these cities don’t exist in isolation, and are instead cogs in the wheels of larger megaregions. Such areas would be comparable to the Northeast U.S., in which New York City, Philadelphia, Boston, Baltimore, and Washington, D.C. are all hours apart and remain largely integrated as a regional economy.
In China, there are three main megaregions worth noting:
Yangtze River Delta
With a combined GDP of $2.17 trillion, which is comparable to Italy, the Yangtze River Delta contains cities like Shanghai, Suzhou, Hangzhou, Wuxi, Ningbo, and Changzhou.
Pearl River Delta
With a combined GDP of $1.89 trillion, which is comparable to South Korea, the Pearl River Delta has cities like Hong Kong, Guangzhou, Shenzhen, Foshan, Dongguan, and Macao.
Beijing-Tianjin
With a combined GDP of $1.14 trillion, which is comparable to Australia, this megaregion holds the two largest cities in northern China, Beijing and Tianjin. The two cities are a 30-minute bullet train ride apart.
Note: After publication, it was pointed out that GDP figures for the Chinese cities seemed to be adjusted for PPP and that our source (Brookings Institution) incorrectly had labeled them as nominal in the tables of this document. We have since updated the infographic so that everything is based on PPP, and added four new cities as well.


Markets
The European Stock Market: Attractive Valuations Offer Opportunities
On average, the European stock market has valuations that are nearly 50% lower than U.S. valuations. But how can you access the market?


European Stock Market: Attractive Valuations Offer Opportunities
Europe is known for some established brands, from L’Oréal to Louis Vuitton. However, the European stock market offers additional opportunities that may be lesser known.
The above infographic, sponsored by STOXX, outlines why investors may want to consider European stocks.
Attractive Valuations
Compared to most North American and Asian markets, European stocks offer lower or comparable valuations.
| Index | Price-to-Earnings Ratio | Price-to-Book Ratio |
|---|---|---|
| EURO STOXX 50 | 14.9 | 2.2 |
| STOXX Europe 600 | 14.4 | 2 |
| U.S. | 25.9 | 4.7 |
| Canada | 16.1 | 1.8 |
| Japan | 15.4 | 1.6 |
| Asia Pacific ex. China | 17.1 | 1.8 |
Data as of February 29, 2024. See graphic for full index names. Ratios based on trailing 12 month financials. The price to earnings ratio excludes companies with negative earnings.
On average, European valuations are nearly 50% lower than U.S. valuations, potentially offering an affordable entry point for investors.
Research also shows that lower price ratios have historically led to higher long-term returns.
Market Movements Not Closely Connected
Over the last decade, the European stock market had low-to-moderate correlation with North American and Asian equities.
The below chart shows correlations from February 2014 to February 2024. A value closer to zero indicates low correlation, while a value of one would indicate that two regions are moving in perfect unison.
| EURO STOXX 50 | STOXX EUROPE 600 | U.S. | Canada | Japan | Asia Pacific ex. China |
|
|---|---|---|---|---|---|---|
| EURO STOXX 50 | 1.00 | 0.97 | 0.55 | 0.67 | 0.24 | 0.43 |
| STOXX EUROPE 600 | 1.00 | 0.56 | 0.71 | 0.28 | 0.48 | |
| U.S. | 1.00 | 0.73 | 0.12 | 0.25 | ||
| Canada | 1.00 | 0.22 | 0.40 | |||
| Japan | 1.00 | 0.88 | ||||
| Asia Pacific ex. China | 1.00 |
Data is based on daily USD returns.
European equities had relatively independent market movements from North American and Asian markets. One contributing factor could be the differing sector weights in each market. For instance, technology makes up a quarter of the U.S. market, but health care and industrials dominate the broader European market.
Ultimately, European equities can enhance portfolio diversification and have the potential to mitigate risk for investors.
Tracking the Market
For investors interested in European equities, STOXX offers a variety of flagship indices:
| Index | Description | Market Cap |
|---|---|---|
| STOXX Europe 600 | Pan-regional, broad market | €10.5T |
| STOXX Developed Europe | Pan-regional, broad-market | €9.9T |
| STOXX Europe 600 ESG-X | Pan-regional, broad market, sustainability focus | €9.7T |
| STOXX Europe 50 | Pan-regional, blue-chip | €5.1T |
| EURO STOXX 50 | Eurozone, blue-chip | €3.5T |
Data is as of February 29, 2024. Market cap is free float, which represents the shares that are readily available for public trading on stock exchanges.
The EURO STOXX 50 tracks the Eurozone’s biggest and most traded companies. It also underlies one of the world’s largest ranges of ETFs and mutual funds. As of November 2023, there were €27.3 billion in ETFs and €23.5B in mutual fund assets under management tracking the index.
“For the past 25 years, the EURO STOXX 50 has served as an accurate, reliable and tradable representation of the Eurozone equity market.”
— Axel Lomholt, General Manager at STOXX
Partnering with STOXX to Track the European Stock Market
Are you interested in European equities? STOXX can be a valuable partner:
- Comprehensive, liquid and investable ecosystem
- European heritage, global reach
- Highly sophisticated customization capabilities
- Open architecture approach to using data
- Close partnerships with clients
- Part of ISS STOXX and Deutsche Börse Group
With a full suite of indices, STOXX can help you benchmark against the European stock market.
Learn how STOXX’s European indices offer liquid and effective market access.

-

 Economy2 days ago
Economic Growth Forecasts for G7 and BRICS Countries in 2024
The IMF has released its economic growth forecasts for 2024. How do the G7 and BRICS countries compare?
-

 Markets1 week ago
U.S. Debt Interest Payments Reach $1 Trillion
U.S. debt interest payments have surged past the $1 trillion dollar mark, amid high interest rates and an ever-expanding debt burden.
-

 United States2 weeks ago
Ranked: The Largest U.S. Corporations by Number of Employees
We visualized the top U.S. companies by employees, revealing the massive scale of retailers like Walmart, Target, and Home Depot.
-

 Markets2 weeks ago
The Top 10 States by Real GDP Growth in 2023
This graphic shows the states with the highest real GDP growth rate in 2023, largely propelled by the oil and gas boom.
-

 Markets2 weeks ago
Ranked: The World’s Top Flight Routes, by Revenue
In this graphic, we show the highest earning flight routes globally as air travel continued to rebound in 2023.
-

 Markets2 weeks ago
Ranked: The Most Valuable Housing Markets in America
The U.S. residential real estate market is worth a staggering $47.5 trillion. Here are the most valuable housing markets in the country.

-

 Energy1 week ago
The World’s Biggest Nuclear Energy Producers
-

 Money2 weeks ago
Which States Have the Highest Minimum Wage in America?
-

 Technology2 weeks ago
Ranked: Semiconductor Companies by Industry Revenue Share
-
Markets2 weeks ago
Ranked: The World’s Top Flight Routes, by Revenue
-

 Countries2 weeks ago
Population Projections: The World’s 6 Largest Countries in 2075
-
Markets2 weeks ago
The Top 10 States by Real GDP Growth in 2023
-

 Demographics2 weeks ago
The Smallest Gender Wage Gaps in OECD Countries
-

 United States2 weeks ago
Where U.S. Inflation Hit the Hardest in March 2024