Misc
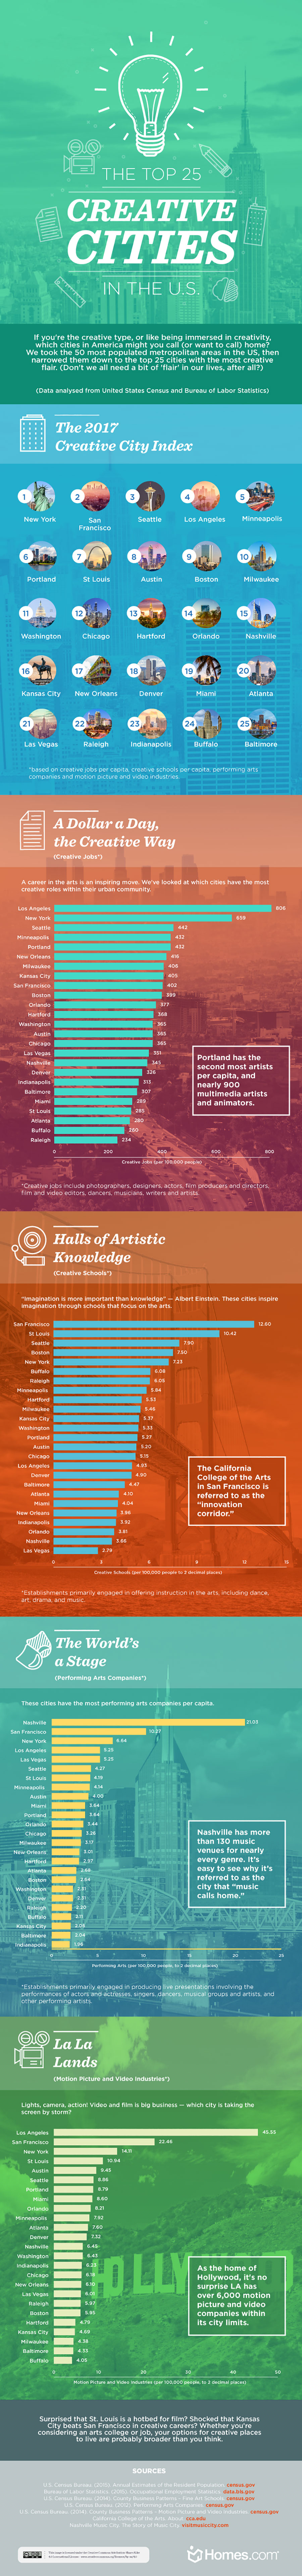
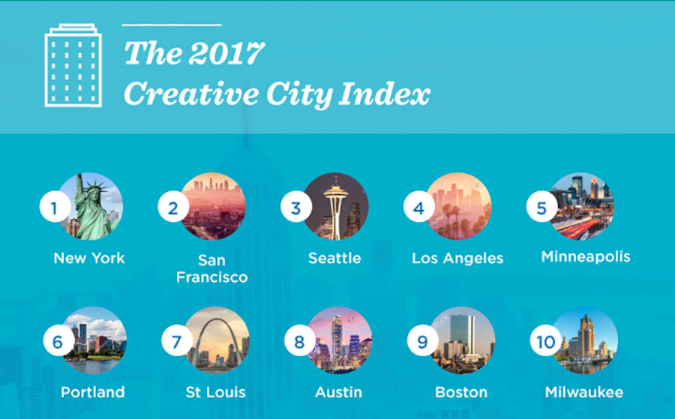
The 2017 Creative City Index
Much has been written about the role of the creative economy as a key indicator of economic health. The “rise of the creative class” and “creative clusters” are concepts that inform the larger conversation on cities as the economic drivers of regions. As a result, everyone from academics to governments are increasingly looking for ways to measure the scope and size of the creative economy.
According to the U.S. Bureau of Economic Analysis, the creative economy accounts for 4.2% of the GDP and is valued at $704 billion. It’s also a segment of the economy that’s still growing. For example, art director and graphic design jobs are growing across the country at rates of 9% and 13%, respectively.
While there is no consensus on where to draw the line on what jobs or sectors are “creative”, we do know that cities are the primary places where measurable creative activities take place.
Today’s infographic from Homes.com measures the number of creative jobs, creative schools, performing arts companies, and motion picture and video companies, to create the Creative City Index. While not comprehensive, it is an interesting snapshot of the creative economy of the country.
Regional Hubs
Perhaps surprisingly to some, St. Louis ranked highly in multiple categories, including education, with a high number of creative schools per capita. St. Louis also has a healthy motion picture and video editing sector.
As housing in larger cities continues to rise out of reach for many artists and creative professionals, smaller creative hubs like St. Louis and Minneapolis could benefit from an influx of people seeking a more affordable lifestyle.
Urban Heavyweights
New York ranked as not only America’s top creative city, but the world’s top creative hub according to a report by UNESCO and EY. As the chart below demonstrates, the creative sector is the fastest-growing segment of NYC’s economy, outpacing many traditional economic drivers.
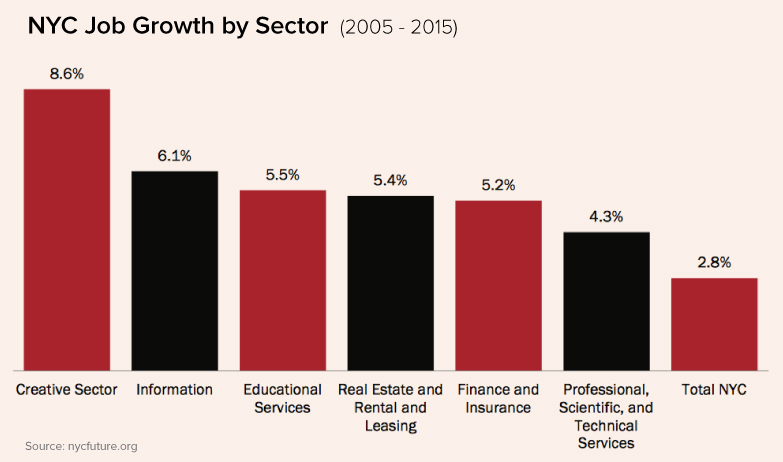
Not surprisingly, New York City dominates in specific creative categories. For example, 28% of the nation’s fashion designers reside in the five boroughs.
As it turns out, creative economies in larger cities benefit immensely from specialization. In the visualization below, orange dots represent creative jobs in sectors more unique to that metro area. The yellow dots represent more common creative jobs. Essentially, Boston’s creative jobs are tied to industries that are unique to that region, while a city like Las Vegas (which ranked low in the index) offers creative jobs that are less specialized.
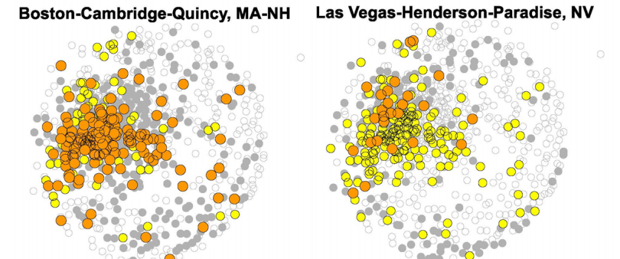
The pathway to a robust creative economy requires creative jobs to grow alongside other specialized non-creative industries. This is a major reason cities with a strong technology industry presence also tended to rank well on the Creative City Index.


VC+
VC+: Get Our Key Takeaways From the IMF’s World Economic Outlook
A sneak preview of the exclusive VC+ Special Dispatch—your shortcut to understanding IMF’s World Economic Outlook report.

Have you read IMF’s latest World Economic Outlook yet? At a daunting 202 pages, we don’t blame you if it’s still on your to-do list.
But don’t worry, you don’t need to read the whole April release, because we’ve already done the hard work for you.
To save you time and effort, the Visual Capitalist team has compiled a visual analysis of everything you need to know from the report—and our VC+ Special Dispatch is available exclusively to VC+ members. All you need to do is log into the VC+ Archive.
If you’re not already subscribed to VC+, make sure you sign up now to access the full analysis of the IMF report, and more (we release similar deep dives every week).
For now, here’s what VC+ members get to see.
Your Shortcut to Understanding IMF’s World Economic Outlook
With long and short-term growth prospects declining for many countries around the world, this Special Dispatch offers a visual analysis of the key figures and takeaways from the IMF’s report including:
- The global decline in economic growth forecasts
- Real GDP growth and inflation forecasts for major nations in 2024
- When interest rate cuts will happen and interest rate forecasts
- How debt-to-GDP ratios have changed since 2000
- And much more!

Get the Full Breakdown in the Next VC+ Special Dispatch
VC+ members can access the full Special Dispatch by logging into the VC+ Archive, where you can also check out previous releases.
Make sure you join VC+ now to see exclusive charts and the full analysis of key takeaways from IMF’s World Economic Outlook.
Don’t miss out. Become a VC+ member today.
What You Get When You Become a VC+ Member
VC+ is Visual Capitalist’s premium subscription. As a member, you’ll get the following:
- Special Dispatches: Deep dive visual briefings on crucial reports and global trends
- Markets This Month: A snappy summary of the state of the markets and what to look out for
- The Trendline: Weekly curation of the best visualizations from across the globe
- Global Forecast Series: Our flagship annual report that covers everything you need to know related to the economy, markets, geopolitics, and the latest tech trends
- VC+ Archive: Hundreds of previously released VC+ briefings and reports that you’ve been missing out on, all in one dedicated hub
You can get all of the above, and more, by joining VC+ today.

-

 Mining1 week ago
Gold vs. S&P 500: Which Has Grown More Over Five Years?
-

 Markets2 weeks ago
Ranked: The Most Valuable Housing Markets in America
-

 Money2 weeks ago
Which States Have the Highest Minimum Wage in America?
-

 AI2 weeks ago
Ranked: Semiconductor Companies by Industry Revenue Share
-

 Markets2 weeks ago
Ranked: The World’s Top Flight Routes, by Revenue
-

 Countries2 weeks ago
Population Projections: The World’s 6 Largest Countries in 2075
-

 Markets2 weeks ago
The Top 10 States by Real GDP Growth in 2023
-

 Demographics2 weeks ago
The Smallest Gender Wage Gaps in OECD Countries