Money
Ranked: The World’s Richest Billionaires Over the Past 10 Years
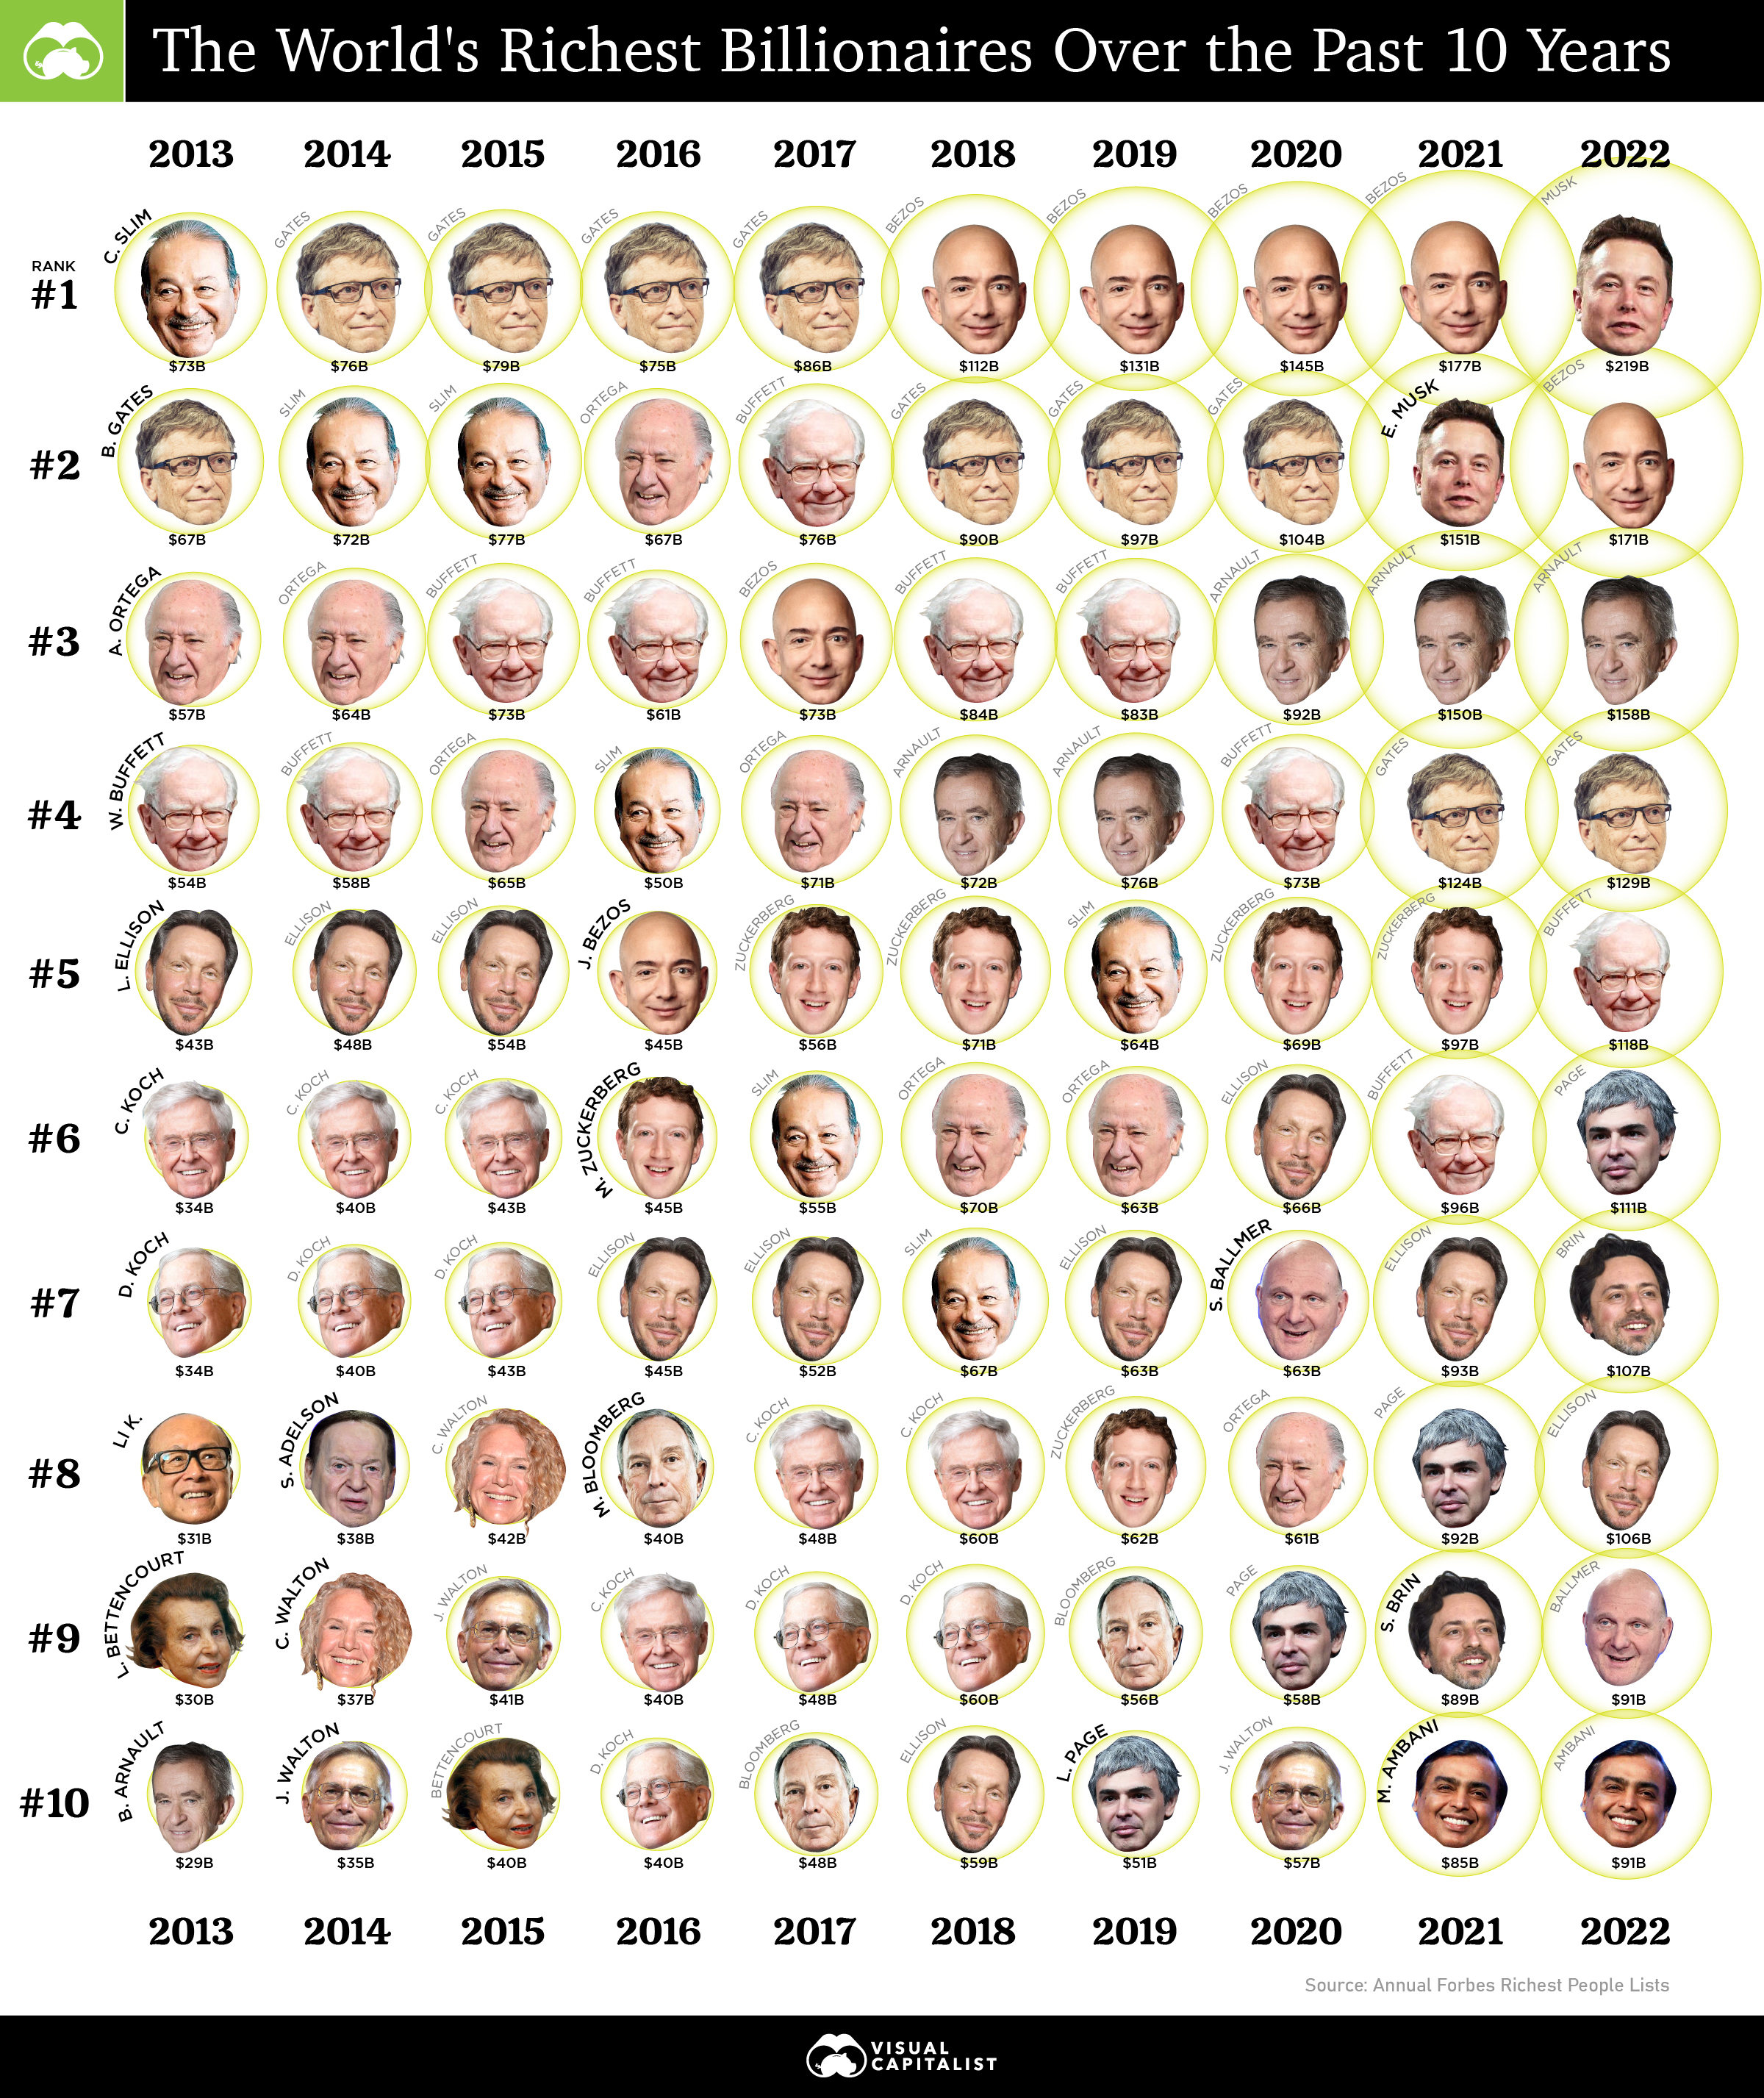


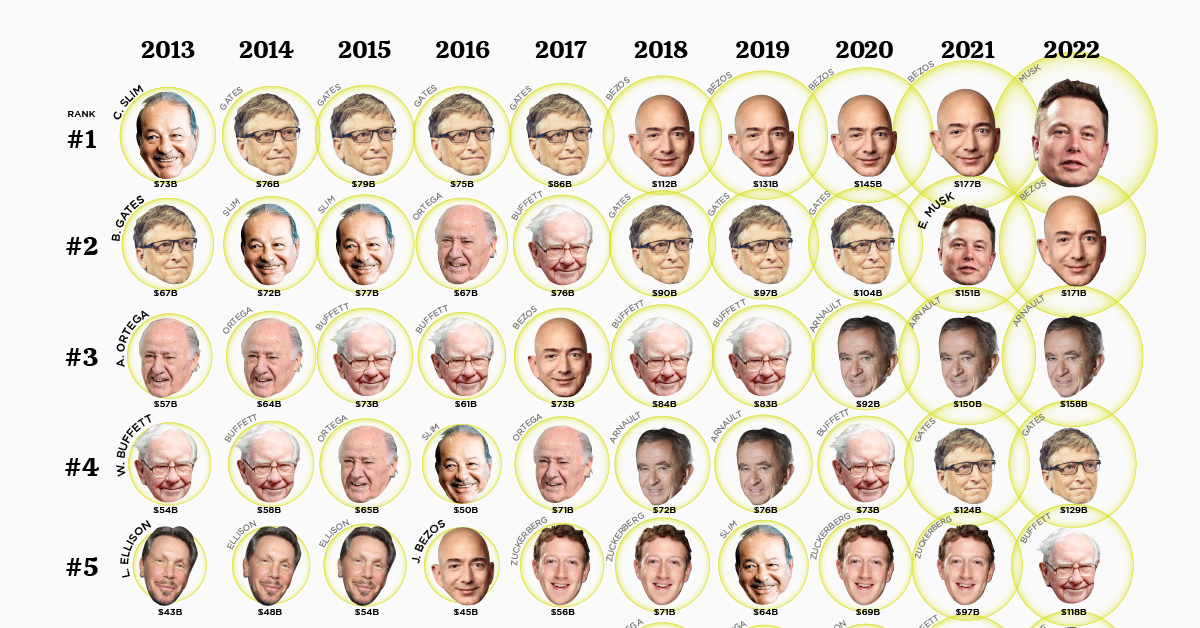
Ranked: The World’s Richest Billionaires Over the Past 10 Years
The last decade has seen a number of changes in the world’s richest billionaires list.
For one, there are new faces at the top of the leaderboard that were never there before. One of the most obvious changes though, is that the richest billionaires have accumulated a lot more wealth in recent years.
Using annual data from Forbes on the richest billionaires, we’ve visualized the wealth and ranking of the top 10 billionaires over the past decade.
Who are the World’s Richest Billionaires?
While the pecking order has fluctuated, the leaderboard remains very exclusive. Out of a possible 10 spots, there are only 19 individuals that have made the list over the last decade.
Here’s the current list of richest billionaires in 2022, including when they first made the list (if in the last decade):
| Rank | Name | Country | Net Worth (2022) | First Year on List* |
|---|---|---|---|---|
| #1 | Elon Musk | 🇺🇸 U.S. | $219 billion | 2021 |
| #2 | Jeff Bezos | 🇺🇸 U.S. | $171 billion | 2016 |
| #3 | Bernard Arnault | 🇫🇷 France | $158 billion | - |
| #4 | Bill Gates | 🇺🇸 U.S. | $129 billion | - |
| #5 | Warren Buffett | 🇺🇸 U.S. | $118 billion | - |
| #6 | Larry Page | 🇺🇸 U.S. | $111 billion | 2019 |
| #7 | Sergey Brin | 🇺🇸 U.S. | $107 billion | 2021 |
| #8 | Larry Ellison | 🇺🇸 U.S. | $106 billion | - |
| #9 | Steve Ballmer | 🇺🇸 U.S. | $91 billion | 2020 |
| #10 | Mukesh Ambani | 🇮🇳 India | $91 billion | - |
*Billionaires with “-” first made the list at an earlier date. Example: Mukesh Ambani made the 2008 list.
Microsoft co-founder turned philanthropist, Bill Gates, is a perennial presence at the top of these lists. Gates is currently at his lowest rank over this time period, but is still in fourth spot. The billionaire has pledged to give away nearly all of his fortune to the eponymously named Bill & Melinda Gates Foundation.
From 2018 to 2021, Jeff Bezos sat at the top of the world’s richest people ranking, only to be bumped out by Elon Musk. In 2020, Bezos became the first person to amass a $200 billion fortune after Amazon’s stock price surged during the pandemic. In recent months, Bezos’ net worth has taken a hit as Amazon’s share price has fallen back down to Earth.
Today, Elon Musk is the world’s richest person.
The Rich Get Richer
Over time, the median net worth of the richest billionaires has grown significantly.
| Year | Median Net Worth of Top 10 Billionaires |
|---|---|
| 2013 | $39 billion |
| 2014 | $44 billion |
| 2015 | $49 billion |
| 2016 | $45 billion |
| 2017 | $56 billion |
| 2018 | $71 billion |
| 2019 | $64 billion |
| 2020 | $68 billion |
| 2021 | $97 billion |
| 2022 | $115 billion |
Most fortunes are held in the form of business equity, real estate, and publicly-traded stocks—all asset classes that have benefited from the era of cheap money and ultra-low interest rates.
Over the decade period, the median net worth of the top 10 billionaires has nearly tripled from $39 billion to $115 billion.
In fact, the first billionaire to pass the $100 billion threshold was Jeff Bezos in 2018, when he took the top spot on the list from Bill Gates. However, now all but two on the top 10 wealthiest list are centibillionaires.


Money
Charted: Which City Has the Most Billionaires in 2024?
Just two countries account for half of the top 20 cities with the most billionaires. And the majority of the other half are found in Asia.


Charted: Which Country Has the Most Billionaires in 2024?
This was originally posted on our Voronoi app. Download the app for free on iOS or Android and discover incredible data-driven charts from a variety of trusted sources.
Some cities seem to attract the rich. Take New York City for example, which has 340,000 high-net-worth residents with investable assets of more than $1 million.
But there’s a vast difference between being a millionaire and a billionaire. So where do the richest of them all live?
Using data from the Hurun Global Rich List 2024, we rank the top 20 cities with the highest number of billionaires in 2024.
A caveat to these rich lists: sources often vary on figures and exact rankings. For example, in last year’s reports, Forbes had New York as the city with the most billionaires, while the Hurun Global Rich List placed Beijing at the top spot.
Ranked: Top 20 Cities with the Most Billionaires in 2024
The Chinese economy’s doldrums over the course of the past year have affected its ultra-wealthy residents in key cities.
Beijing, the city with the most billionaires in 2023, has not only ceded its spot to New York, but has dropped to #4, overtaken by London and Mumbai.
| Rank | City | Billionaires | Rank Change YoY |
|---|---|---|---|
| 1 | 🇺🇸 New York | 119 | +1 |
| 2 | 🇬🇧 London | 97 | +3 |
| 3 | 🇮🇳 Mumbai | 92 | +4 |
| 4 | 🇨🇳 Beijing | 91 | -3 |
| 5 | 🇨🇳 Shanghai | 87 | -2 |
| 6 | 🇨🇳 Shenzhen | 84 | -2 |
| 7 | 🇭🇰 Hong Kong | 65 | -1 |
| 8 | 🇷🇺 Moscow | 59 | No Change |
| 9 | 🇮🇳 New Delhi | 57 | +6 |
| 10 | 🇺🇸 San Francisco | 52 | No Change |
| 11 | 🇹🇭 Bangkok | 49 | +2 |
| 12 | 🇹🇼 Taipei | 45 | +2 |
| 13 | 🇫🇷 Paris | 44 | -2 |
| 14 | 🇨🇳 Hangzhou | 43 | -5 |
| 15 | 🇸🇬 Singapore | 42 | New to Top 20 |
| 16 | 🇨🇳 Guangzhou | 39 | -4 |
| 17T | 🇮🇩 Jakarta | 37 | +1 |
| 17T | 🇧🇷 Sao Paulo | 37 | No Change |
| 19T | 🇺🇸 Los Angeles | 31 | No Change |
| 19T | 🇰🇷 Seoul | 31 | -3 |
In fact all Chinese cities on the top 20 list have lost billionaires between 2023–24. Consequently, they’ve all lost ranking spots as well, with Hangzhou seeing the biggest slide (-5) in the top 20.
Where China lost, all other Asian cities—except Seoul—in the top 20 have gained ranks. Indian cities lead the way, with New Delhi (+6) and Mumbai (+3) having climbed the most.
At a country level, China and the U.S combine to make up half of the cities in the top 20. They are also home to about half of the world’s 3,200 billionaire population.
In other news of note: Hurun officially counts Taylor Swift as a billionaire, estimating her net worth at $1.2 billion.

-

 Education1 week ago
How Hard Is It to Get Into an Ivy League School?
-

 Technology2 weeks ago
Ranked: Semiconductor Companies by Industry Revenue Share
-

 Markets2 weeks ago
Ranked: The World’s Top Flight Routes, by Revenue
-

 Demographics2 weeks ago
Population Projections: The World’s 6 Largest Countries in 2075
-

 Markets2 weeks ago
The Top 10 States by Real GDP Growth in 2023
-

 Demographics2 weeks ago
The Smallest Gender Wage Gaps in OECD Countries
-

 Economy2 weeks ago
Where U.S. Inflation Hit the Hardest in March 2024
-

 Environment2 weeks ago
Top Countries By Forest Growth Since 2001