Markets
Charting the World’s Major Stock Markets on the Same Scale (1990-2019)
Charting the World’s Major Stock Markets
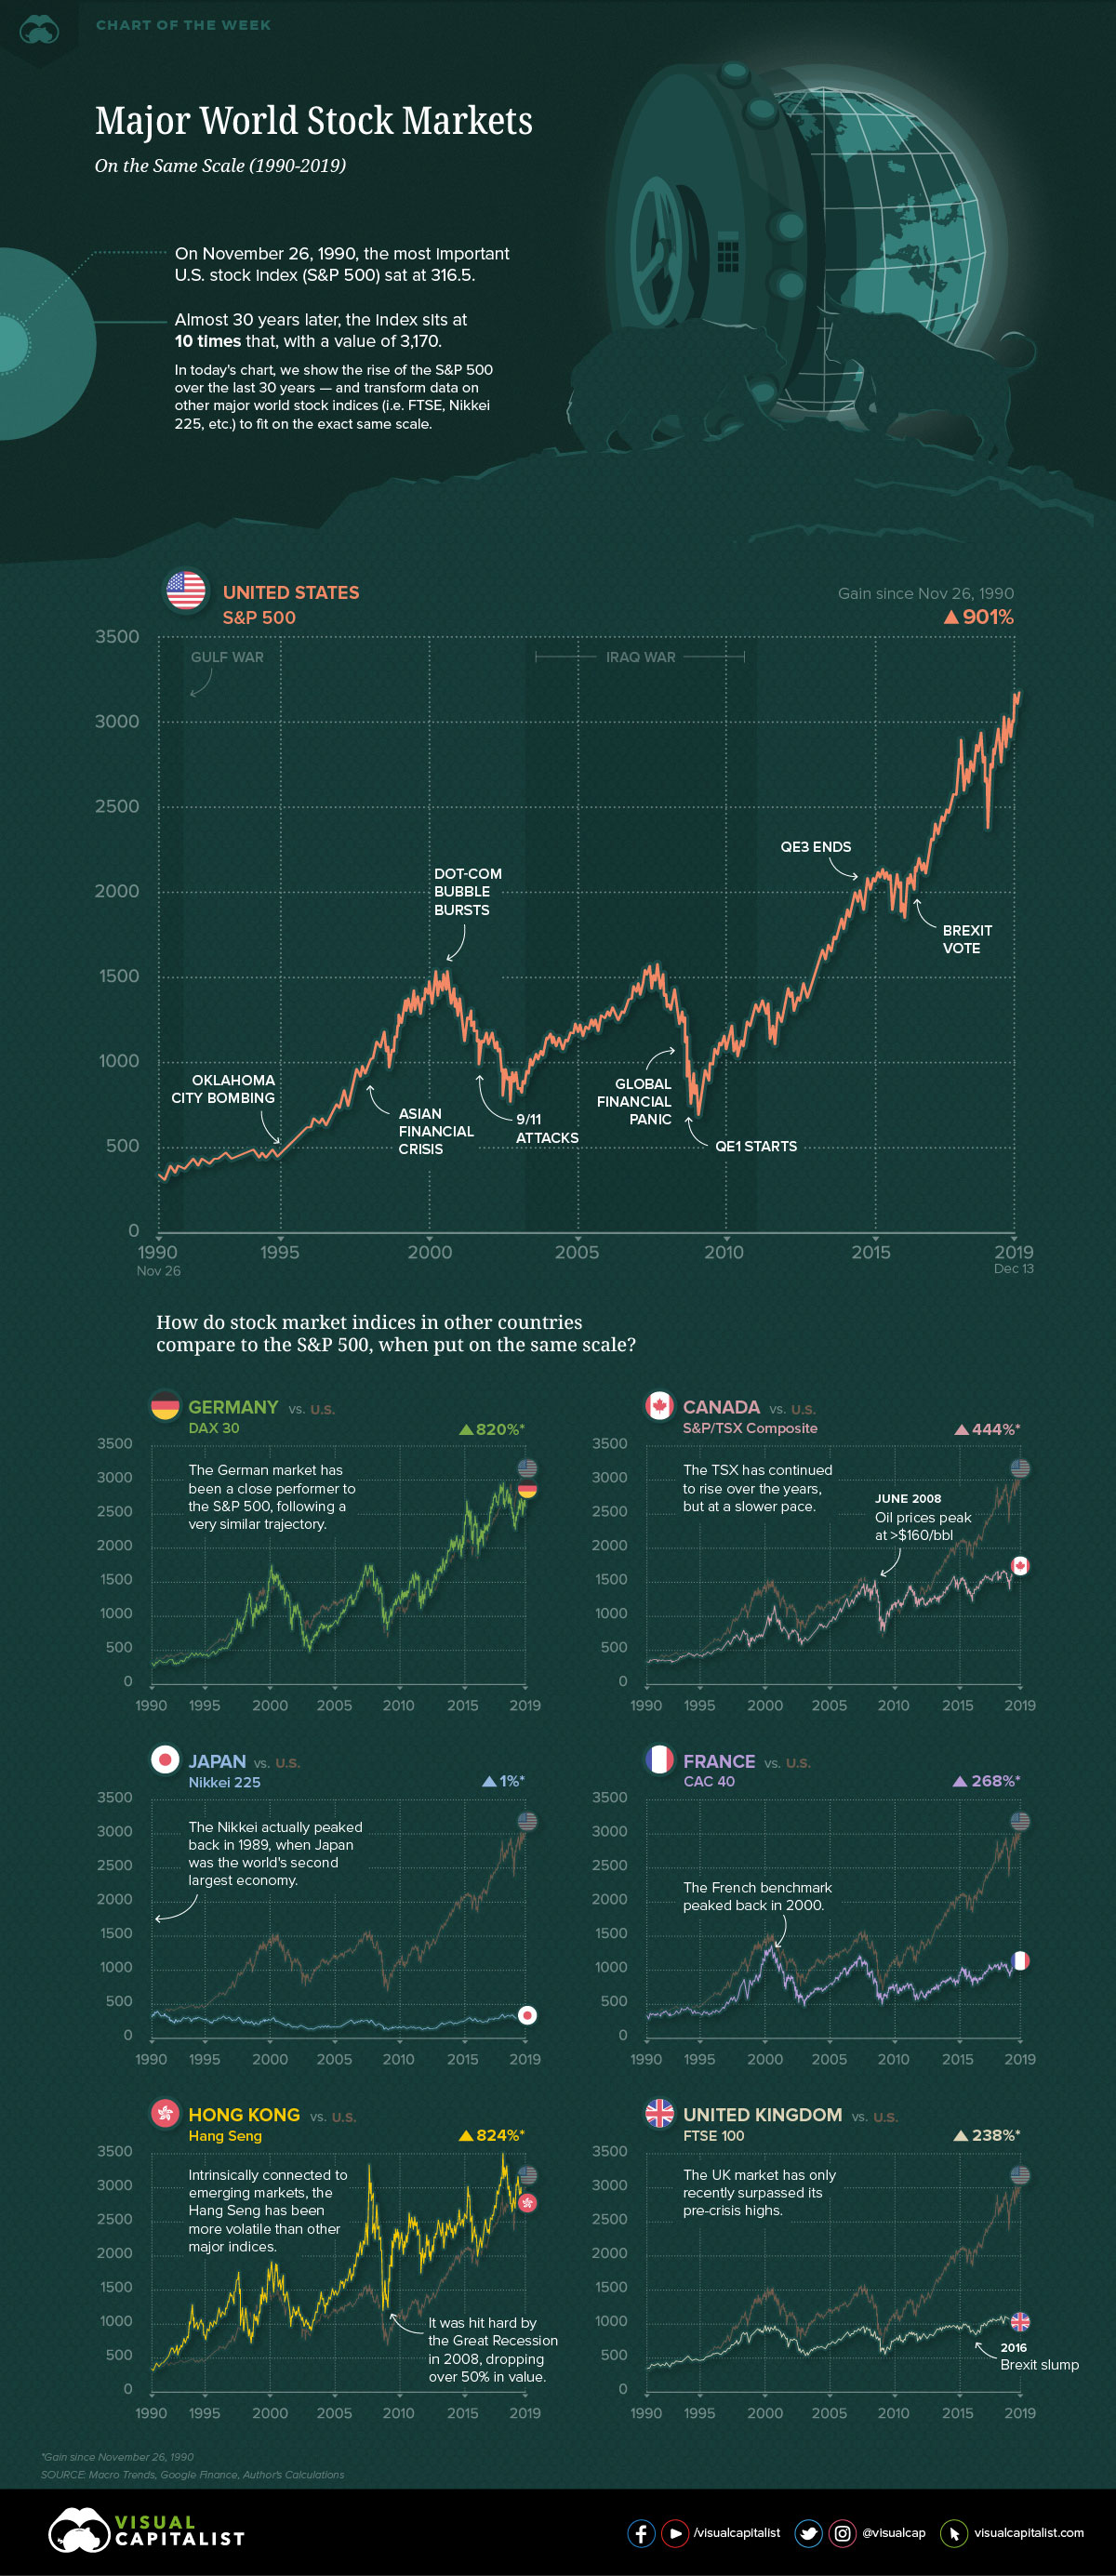
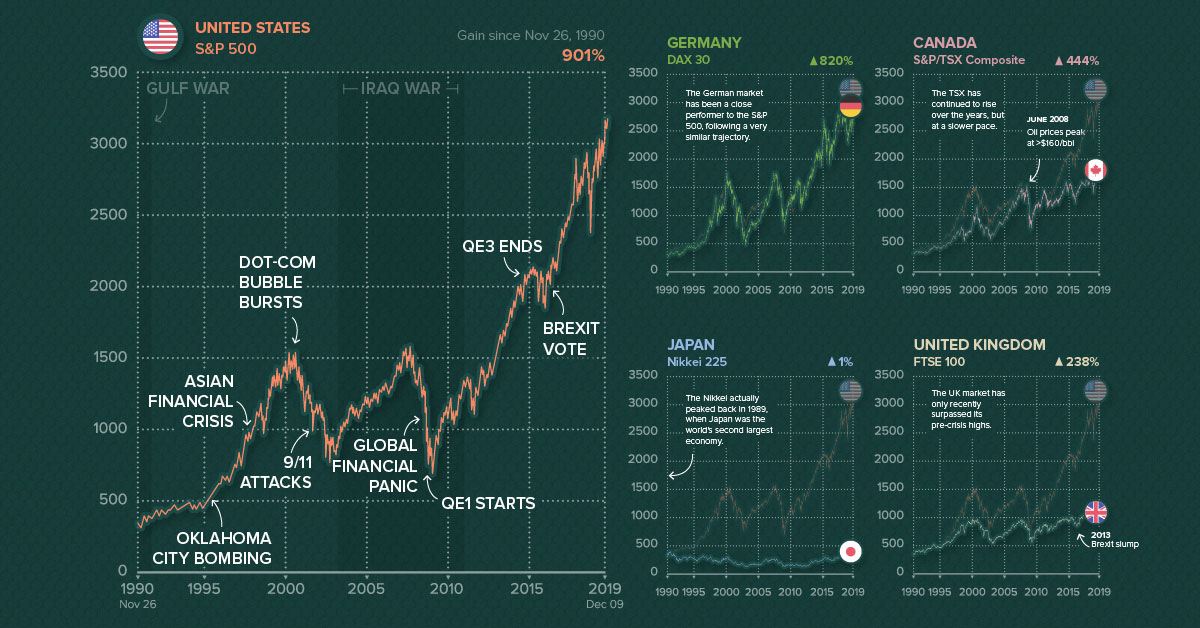
Most investors around the world are familiar with the S&P 500 index.
Not only is it the most widely accepted barometer of U.S. stock market performance, but it’s also been on a 10-year bull run, now sitting at all-time highs near 3,170.
This week, we chart those historical returns, and then use the U.S. benchmark as a backdrop to compare other major stock markets around the world, such as those in Europe, Asia, and Canada.
Putting Them All at Scale
One challenge in comparing global markets directly is that all indices are on arbitrary scales.
To directly compare them, the most natural option would be to transform the data to percentage terms. While that’s all fine and dandy, it’s also a little boring.
To make things more interesting, we’ve collected historical data that goes back nearly 30 years for each index. This was mostly done using Macrotrends, a fantastic resource for historical data. We used November 26th, 1990 as a cut-off date, since that was the earliest data point available for some of the country indices used.
We then transformed all of this data to be on the same scale of the S&P 500, so performance can be directly compared to the common American stock market benchmark.
Comparing Markets Using the S&P 500
Alright, now that we have the same scale for each market, let’s dive into the data:
| Country | Benchmark | Current Value (in S&P 500 terms) | Gain since Nov 26, 1990 |
|---|---|---|---|
| 🇺🇸 United States | S&P 500 | 3,168 | +901% |
| 🇭🇰 Hong Kong | Hang Seng Comp. | 2,926 | +824% |
| 🇩🇪 Germany | DAX 30 | 2,913 | +820% |
| 🇨🇦 Canada | S&P/TSX Comp. | 1,717 | +444% |
| 🇫🇷 France | CAC 40 | 1,160 | +268% |
| 🇬🇧 United Kingdom | FTSE 100 | 1,072 | +238% |
| 🇯🇵 Japan | Nikkei 225 | 315 | +1% |
Note: Data has been transformed to match the scale of the S&P 500, and is current as of December 13, 2019
If you invested $100 in the U.S. market on November 26, 1990, you’d have over $1,000 today.
Over nearly 30 years, the S&P 500 has increased by 901%, which is the most out any of these major indices. If you invested in the German or Hong Kong markets, you’d have fairly similar results as well — each gained more than 800% over the same time period.
Meanwhile, the markets in Canada, France, and the United Kingdom have all increased, but at a far slower pace:
- In S&P 500 terms, Canada would be sitting at 1,717 — which is where the U.S. market was back in 2013.
- France would be at 1,160, a mark the S&P 500 last hit in 2010.
- The United Kingdom would sit at 1,072, also equivalent to 2010 for the U.S. market.
Finally, in S&P 500 terms, the Japanese stock market would be at a lowly 315 points today — roughly where it started 30 years ago. In other words, if you had invested $100 in Japanese stocks in 1990, you’d have gained just $1 over a period of three decades.


Markets
The European Stock Market: Attractive Valuations Offer Opportunities
On average, the European stock market has valuations that are nearly 50% lower than U.S. valuations. But how can you access the market?


European Stock Market: Attractive Valuations Offer Opportunities
Europe is known for some established brands, from L’Oréal to Louis Vuitton. However, the European stock market offers additional opportunities that may be lesser known.
The above infographic, sponsored by STOXX, outlines why investors may want to consider European stocks.
Attractive Valuations
Compared to most North American and Asian markets, European stocks offer lower or comparable valuations.
| Index | Price-to-Earnings Ratio | Price-to-Book Ratio |
|---|---|---|
| EURO STOXX 50 | 14.9 | 2.2 |
| STOXX Europe 600 | 14.4 | 2 |
| U.S. | 25.9 | 4.7 |
| Canada | 16.1 | 1.8 |
| Japan | 15.4 | 1.6 |
| Asia Pacific ex. China | 17.1 | 1.8 |
Data as of February 29, 2024. See graphic for full index names. Ratios based on trailing 12 month financials. The price to earnings ratio excludes companies with negative earnings.
On average, European valuations are nearly 50% lower than U.S. valuations, potentially offering an affordable entry point for investors.
Research also shows that lower price ratios have historically led to higher long-term returns.
Market Movements Not Closely Connected
Over the last decade, the European stock market had low-to-moderate correlation with North American and Asian equities.
The below chart shows correlations from February 2014 to February 2024. A value closer to zero indicates low correlation, while a value of one would indicate that two regions are moving in perfect unison.
| EURO STOXX 50 | STOXX EUROPE 600 | U.S. | Canada | Japan | Asia Pacific ex. China |
|
|---|---|---|---|---|---|---|
| EURO STOXX 50 | 1.00 | 0.97 | 0.55 | 0.67 | 0.24 | 0.43 |
| STOXX EUROPE 600 | 1.00 | 0.56 | 0.71 | 0.28 | 0.48 | |
| U.S. | 1.00 | 0.73 | 0.12 | 0.25 | ||
| Canada | 1.00 | 0.22 | 0.40 | |||
| Japan | 1.00 | 0.88 | ||||
| Asia Pacific ex. China | 1.00 |
Data is based on daily USD returns.
European equities had relatively independent market movements from North American and Asian markets. One contributing factor could be the differing sector weights in each market. For instance, technology makes up a quarter of the U.S. market, but health care and industrials dominate the broader European market.
Ultimately, European equities can enhance portfolio diversification and have the potential to mitigate risk for investors.
Tracking the Market
For investors interested in European equities, STOXX offers a variety of flagship indices:
| Index | Description | Market Cap |
|---|---|---|
| STOXX Europe 600 | Pan-regional, broad market | €10.5T |
| STOXX Developed Europe | Pan-regional, broad-market | €9.9T |
| STOXX Europe 600 ESG-X | Pan-regional, broad market, sustainability focus | €9.7T |
| STOXX Europe 50 | Pan-regional, blue-chip | €5.1T |
| EURO STOXX 50 | Eurozone, blue-chip | €3.5T |
Data is as of February 29, 2024. Market cap is free float, which represents the shares that are readily available for public trading on stock exchanges.
The EURO STOXX 50 tracks the Eurozone’s biggest and most traded companies. It also underlies one of the world’s largest ranges of ETFs and mutual funds. As of November 2023, there were €27.3 billion in ETFs and €23.5B in mutual fund assets under management tracking the index.
“For the past 25 years, the EURO STOXX 50 has served as an accurate, reliable and tradable representation of the Eurozone equity market.”
— Axel Lomholt, General Manager at STOXX
Partnering with STOXX to Track the European Stock Market
Are you interested in European equities? STOXX can be a valuable partner:
- Comprehensive, liquid and investable ecosystem
- European heritage, global reach
- Highly sophisticated customization capabilities
- Open architecture approach to using data
- Close partnerships with clients
- Part of ISS STOXX and Deutsche Börse Group
With a full suite of indices, STOXX can help you benchmark against the European stock market.
Learn how STOXX’s European indices offer liquid and effective market access.

-

 Economy1 day ago
Economic Growth Forecasts for G7 and BRICS Countries in 2024
The IMF has released its economic growth forecasts for 2024. How do the G7 and BRICS countries compare?
-

 Markets1 week ago
U.S. Debt Interest Payments Reach $1 Trillion
U.S. debt interest payments have surged past the $1 trillion dollar mark, amid high interest rates and an ever-expanding debt burden.
-

 United States2 weeks ago
Ranked: The Largest U.S. Corporations by Number of Employees
We visualized the top U.S. companies by employees, revealing the massive scale of retailers like Walmart, Target, and Home Depot.
-

 Markets2 weeks ago
The Top 10 States by Real GDP Growth in 2023
This graphic shows the states with the highest real GDP growth rate in 2023, largely propelled by the oil and gas boom.
-

 Markets2 weeks ago
Ranked: The World’s Top Flight Routes, by Revenue
In this graphic, we show the highest earning flight routes globally as air travel continued to rebound in 2023.
-

 Markets2 weeks ago
Ranked: The Most Valuable Housing Markets in America
The U.S. residential real estate market is worth a staggering $47.5 trillion. Here are the most valuable housing markets in the country.

-

 Mining1 week ago
Gold vs. S&P 500: Which Has Grown More Over Five Years?
-
Markets2 weeks ago
Ranked: The Most Valuable Housing Markets in America
-

 Money2 weeks ago
Which States Have the Highest Minimum Wage in America?
-

 AI2 weeks ago
Ranked: Semiconductor Companies by Industry Revenue Share
-
Markets2 weeks ago
Ranked: The World’s Top Flight Routes, by Revenue
-

 Demographics2 weeks ago
Population Projections: The World’s 6 Largest Countries in 2075
-
Markets2 weeks ago
The Top 10 States by Real GDP Growth in 2023
-

 Demographics2 weeks ago
The Smallest Gender Wage Gaps in OECD Countries