Gold
The World’s Gold and Silver Coin Production vs. Money Creation
Global Gold & Silver Coin Production vs. Money Creation
Note: Data has been updated to correct a previous calculation error pertaining to Japanese Yen money supply.
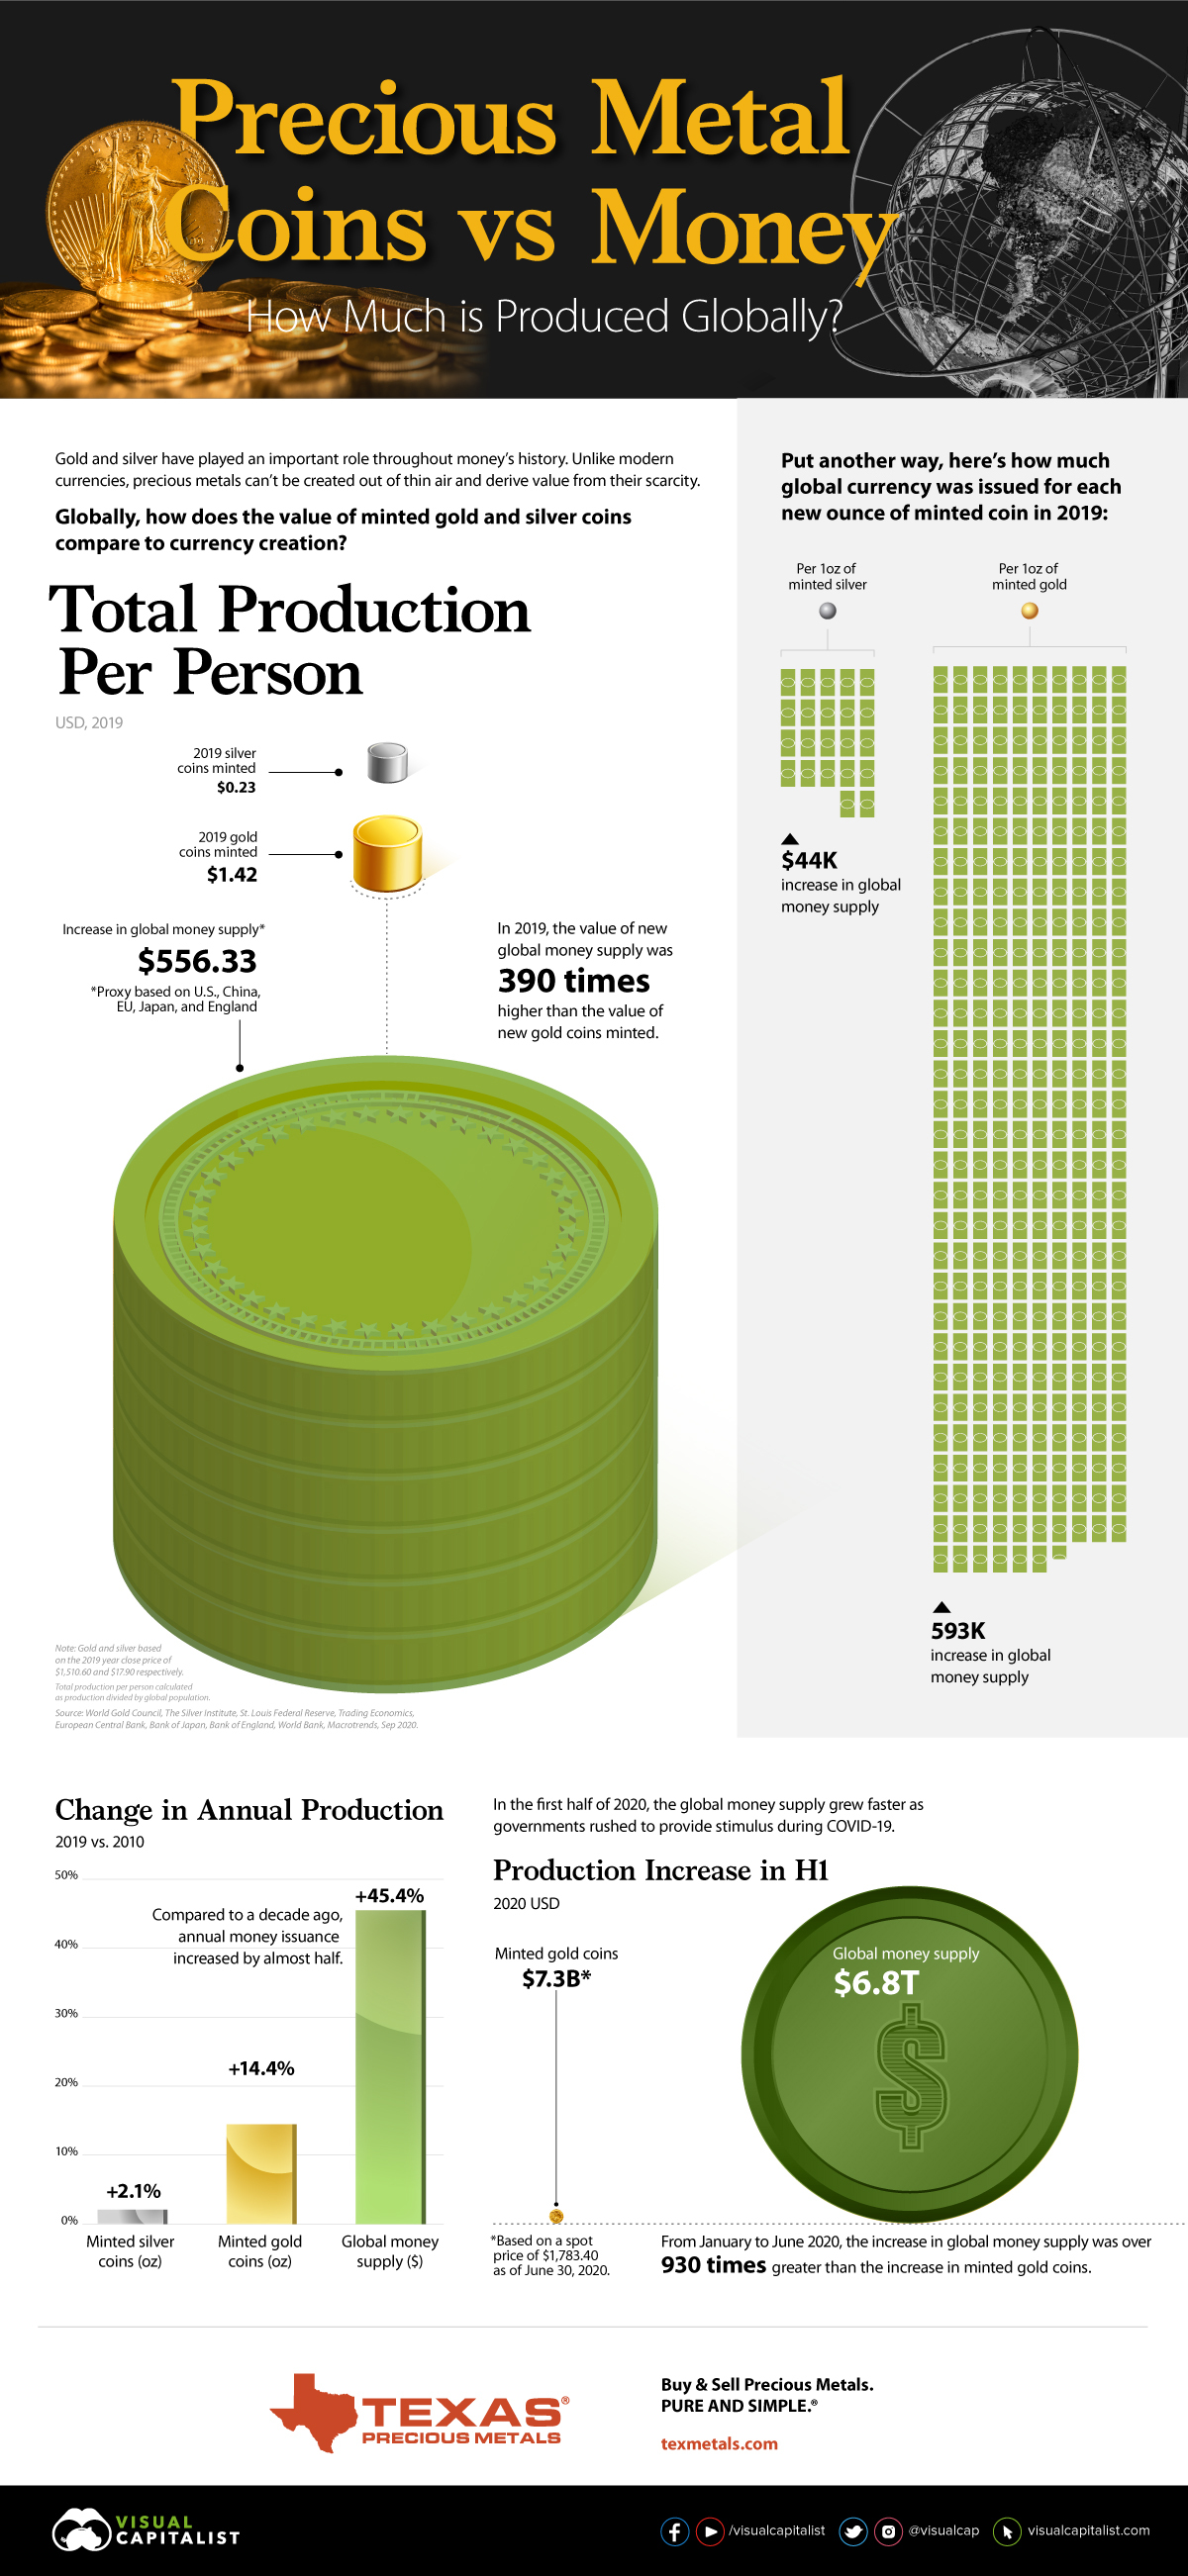
Both precious metals and cash serve as safe haven assets, intended to limit losses during market turmoil. However, while modern currencies can be printed by central governments, precious metals derive value from their scarcity.
In this infographic from Texas Precious Metals, we compare the value of the world’s gold and silver coin production to global money creation.
Total Production Per Person, 2019
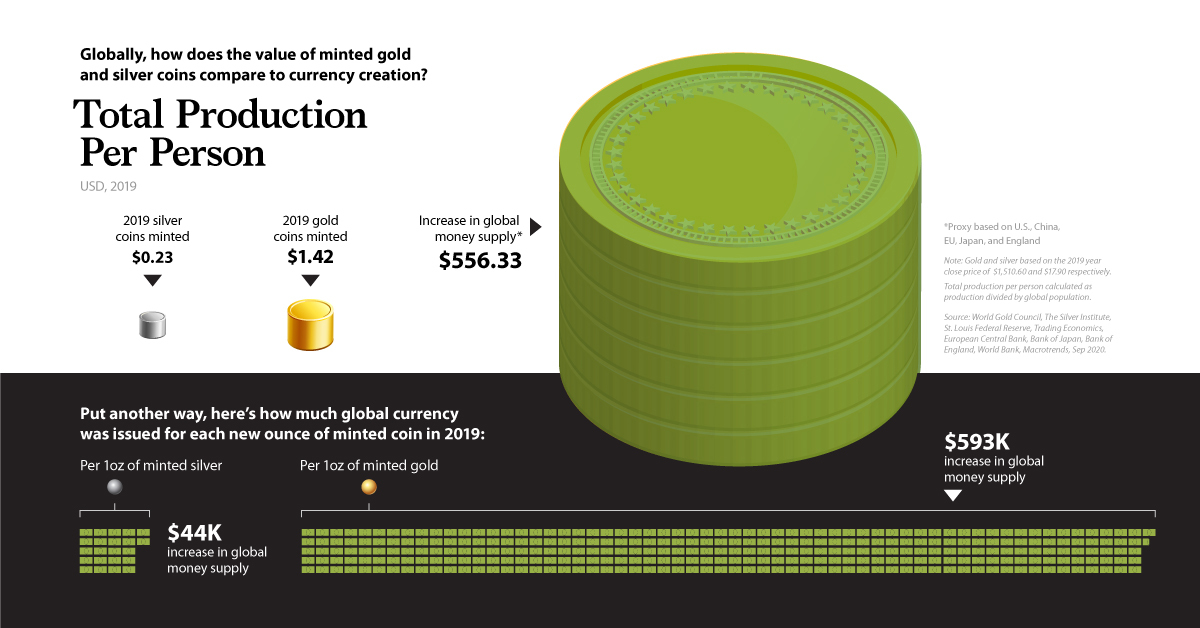
We calculated the value of global currency issuance in 2019 as well as precious metal coins minted, and divided by the global population to get total production per person.
Throughout, global money supply is a proxy based on the 5 largest reserve currencies: the U.S. dollar, Euro, Japanese Yen, Sterling Pound, and Chinese Renminbi.
| 2019 Production | Ounces | Dollar Value | Dollar Value Per Person |
|---|---|---|---|
| Global Gold Coins | 7,204,982 | $10.9B | $1.42 |
| Global Silver Coins | 97,900,000 | $1.8B | $0.23 |
| Global Money Supply | $4.3T | $556.33 |
All numbers are in USD according to exchange rates as of December 31 2019. Gold and silver values are based on the 2019 year close price of $1,510.60 and $17.90 respectively.
The value of new global money supply was 390 times higher than the value of gold coins minted, and 2,400 times higher than silver coins minted.
Put another way, for each ounce of minted gold coin, the global money supply increased by more than $593,000.
Change in Annual Production, 2019 vs. 2010
Compared to the start of the decade, here’s how annual production levels have changed:
| 2010 | 2019 | % change | |
|---|---|---|---|
| Global Silver Coins (oz) | 95,900,000 | 97,900,000 | 2.1% |
| Global Gold Coins (oz) | 6,298,331 | 7,204,982 | 14.4% |
| Global Money Supply (USD) | $2,936,296,692,440 | $4,268,993,639,926 | 45.4% |
Annual increases to global money supply have increased by half, far outpacing the change in the world’s gold and silver coin production.
Even more recently, how has production changed during the COVID-19 pandemic?
The COVID-19 Effect
In response to the global pandemic, central banks have enacted numerous measures to help support economies—including issuing new currency.
The global money supply increased by more than $6.8 trillion in the first half of 2020. In fact, the value of printed currency was 930 times higher than the value of minted gold coins over the same timeframe.
Investors may want to consider which asset is more vulnerable to inflation as they look to protect their portfolios.
Want to learn more? See the U.S. version of this graphic.


Mining
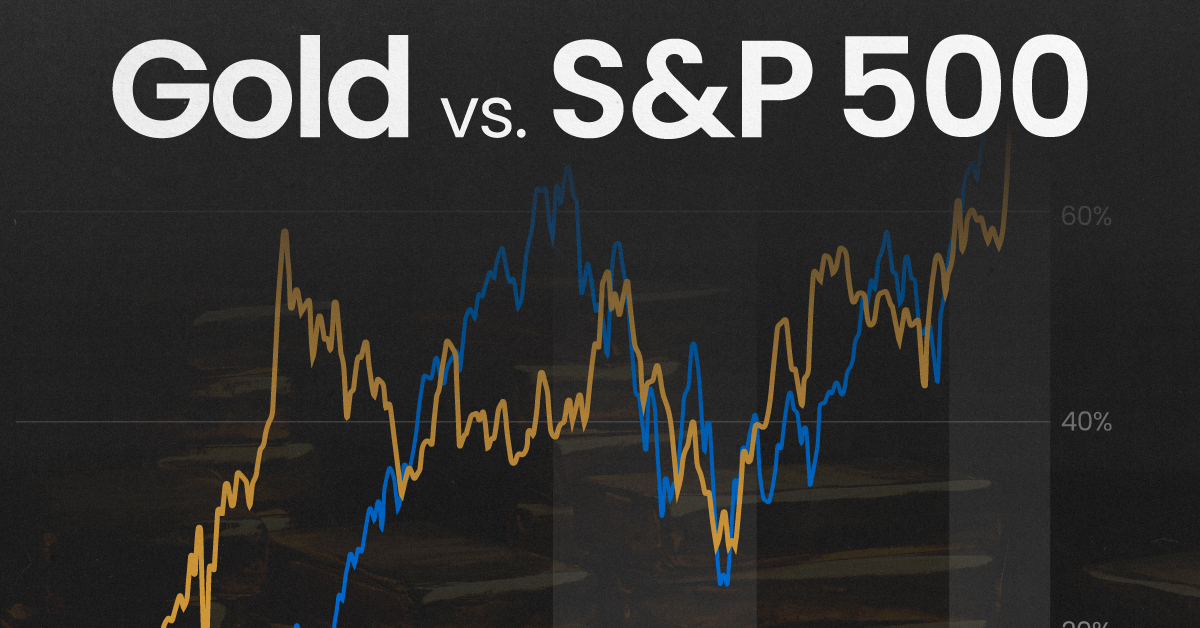
Gold vs. S&P 500: Which Has Grown More Over Five Years?
The price of gold has set record highs in 2024, but how has this precious metal performed relative to the S&P 500?

Gold vs. S&P 500: Which Has Grown More Over Five Years?
This was originally posted on our Voronoi app. Download the app for free on Apple or Android and discover incredible data-driven charts from a variety of trusted sources.
Gold is considered a unique asset due to its enduring value, historical significance, and application in various technologies like computers, spacecraft, and communications equipment.
Commonly regarded as a “safe haven asset”, gold is something investors typically buy to protect themselves during periods of global uncertainty and economic decline.
It is for this reason that gold has performed rather strongly in recent years, and especially in 2024. Persistent inflation combined with multiple wars has driven up demand for gold, helping it set a new all-time high of over $2,400 per ounce.
To put this into perspective, we visualized the performance of gold alongside the S&P 500. See the table below for performance figures as of April 12, 2024.
| Asset/Index | 1 Yr (%) | 5 Yr (%) |
|---|---|---|
| 🏆 Gold | +16.35 | +81.65 |
| 💼 S&P 500 | +25.21 | +76.22 |
Over the five-year period, gold has climbed an impressive 81.65%, outpacing even the S&P 500.
Get Your Gold at Costco
Perhaps a sign of how high the demand for gold is becoming, wholesale giant Costco is reportedly selling up to $200 million worth of gold bars every month in the United States. The year prior, sales only amounted to $100 million per quarter.
Consumers aren’t the only ones buying gold, either. Central banks around the world have been accumulating gold in very large quantities, likely as a hedge against inflation.
According to the World Gold Council, these institutions bought 1,136 metric tons in 2022, marking the highest level since 1950. Figures for 2023 came in at 1,037 metric tons.
See More Graphics on Gold
If you’re fascinated by gold, be sure to check out more Visual Capitalist content including 200 Years of Global Gold Production, by Country or Ranked: The Largest Gold Reserves by Country.

-

 Debt1 week ago
How Debt-to-GDP Ratios Have Changed Since 2000
-

 Markets2 weeks ago
Ranked: The World’s Top Flight Routes, by Revenue
-

 Countries2 weeks ago
Population Projections: The World’s 6 Largest Countries in 2075
-

 Markets2 weeks ago
The Top 10 States by Real GDP Growth in 2023
-

 Demographics2 weeks ago
The Smallest Gender Wage Gaps in OECD Countries
-

 United States2 weeks ago
Where U.S. Inflation Hit the Hardest in March 2024
-

 Green2 weeks ago
Top Countries By Forest Growth Since 2001
-

 United States2 weeks ago
Ranked: The Largest U.S. Corporations by Number of Employees