Markets
Why Investors Tuned Out Netflix
Why Investors Tuned Out Netflix
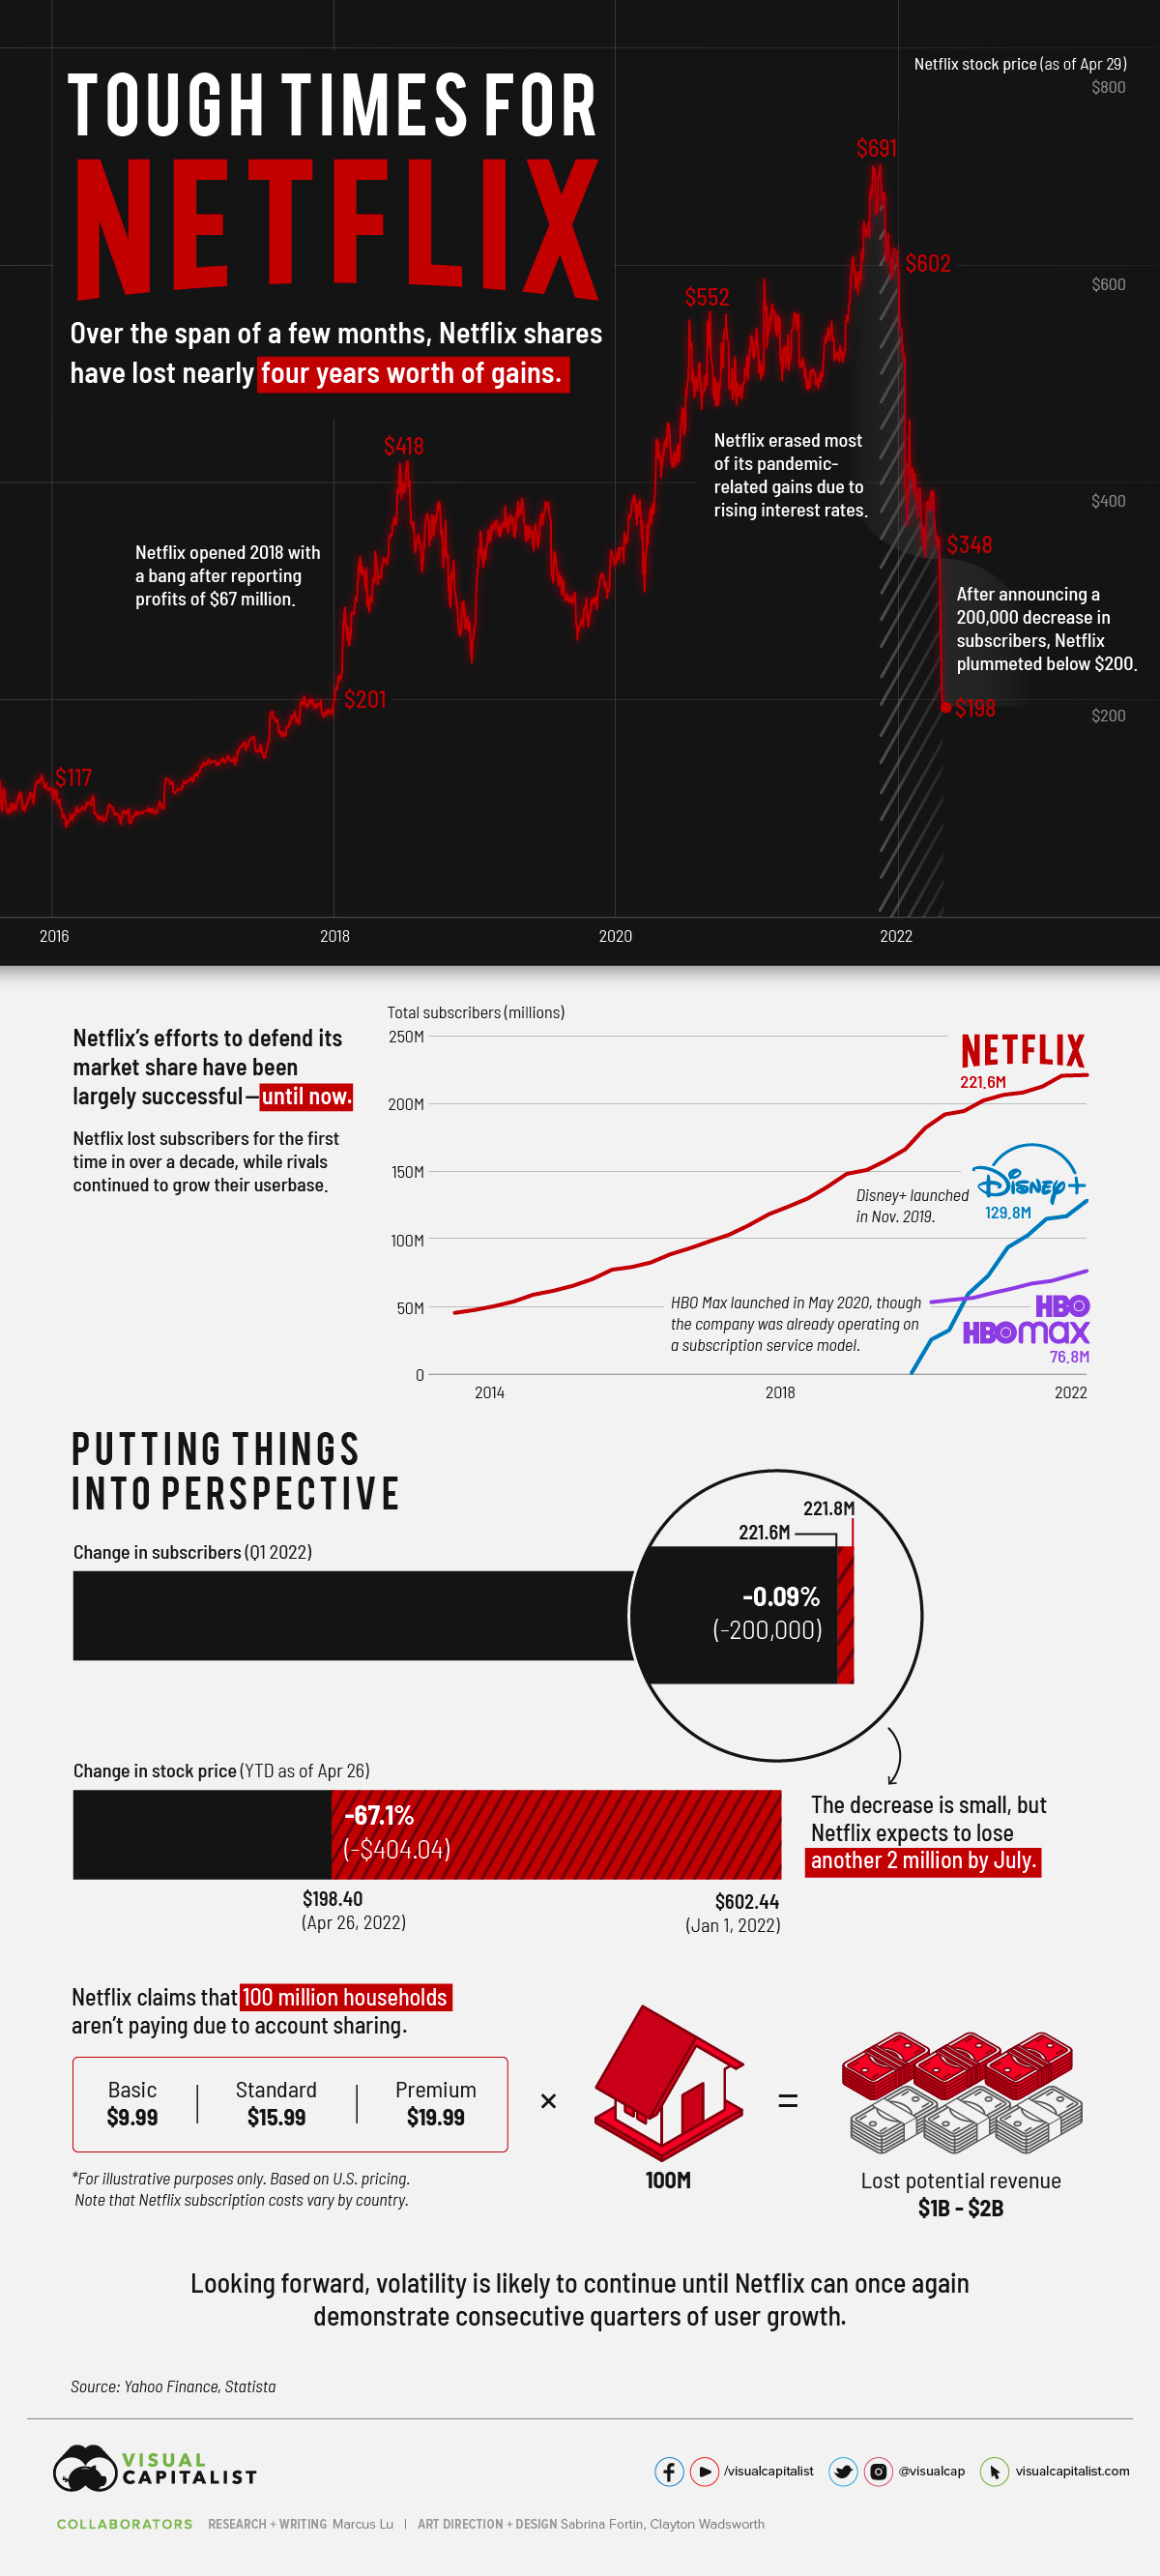
Netflix shares have enjoyed an incredible run over the past decade. Subscriber growth seemed limitless, profitability was improving, and the pandemic gave us a compelling case for watching TV at home.
Things took a drastic turn on April 19, 2022, when Netflix announced its Q1 results. Rather than gaining subscribers as forecasted, the company lost 200,000. This was the first decline in over a decade, and investors rushed to pull their money out.
So, is there a buying opportunity now that Netflix shares are trading at multi-year lows? To help you decide, we’ve provided further context around this historic crash.
Netflix Shares Fall Flat
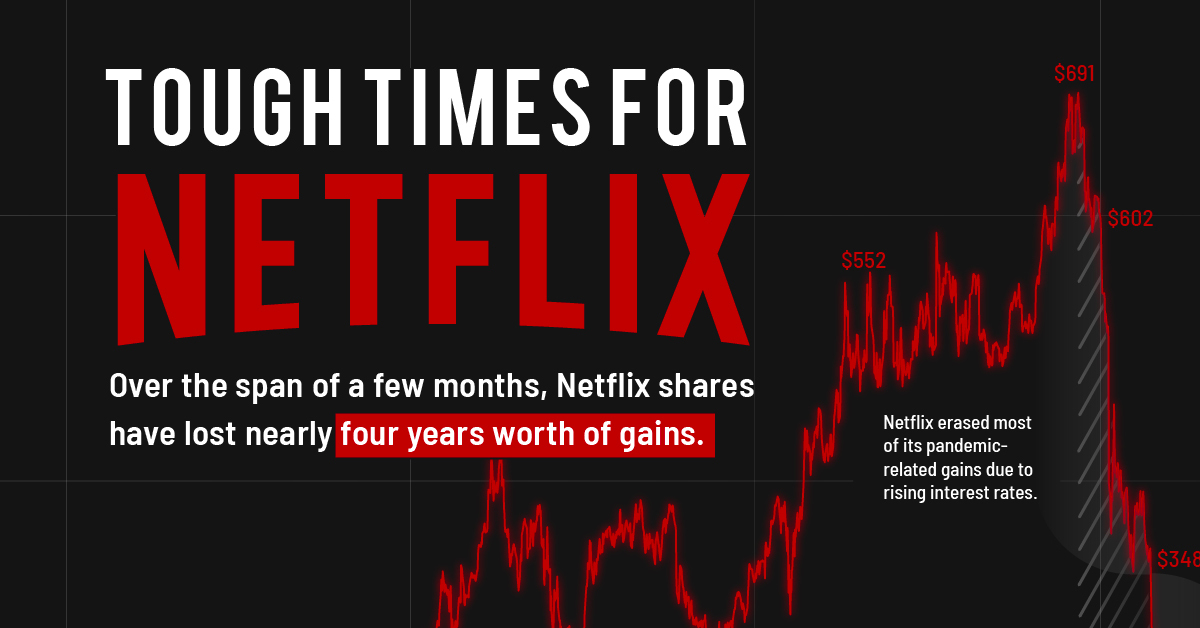
Over the span of a few months, Netflix shares have erased roughly four years worth of gains. Not all of these losses are due to the drop in subscribers, however.
Prior to the Q1 earnings announcement, Netflix had lost most of its pandemic-related gains. This was primarily due to rising interest rates and people spending less time at home. Still, analysts expected Netflix to add 2.7 million subscribers.
After announcing it had lost 200,000 subscribers instead, the stock quickly fell below $200 (the first time since late 2017). YTD performance (as of April 29, 2022) is an abysmal -67%.
What’s to Blame?
Netflix pointed to three culprits for its loss in subscribers:
- The suspension of its services in Russia
- Increasing competition
- Account sharing
Let’s focus on the latter two, starting with competition. The following table compares the number of subscribers between Netflix and two prominent rivals: Disney+ and HBO.
| Date | Netflix Subscribers | Disney+ Subscribers | HBO & HBO Max Subscribers |
|---|---|---|---|
| Q1 2020 | 182.8M | 26.5M | 53.8M |
| Q2 2020 | 192.9M | 33.5M | 55.5M |
| Q3 2020 | 195.1M | 60.5M | 56.9M |
| Q4 2020 | 203.6M | 73.7M | 60.6M |
| Q1 2021 | 207.6M | 94.9M | 63.9M |
| Q2 2021 | 209.2M | 103.6M | 67.5M |
| Q3 2021 | 213.6M | 116.0M | 69.4M |
| Q4 2021 | 221.8M | 118.1M | 73.8M |
| Q1 2022 | 221.6M | 129.8M | 76.8M |
Disney+ was launched in November 2019, while HBO Max was launched in May 2020. HBO (the channel) and HBO Max subscribers are rolled up as one.
Based on this data, Netflix may be starting to feel the heat of competition. A loss in subscribers is bad news, but it’s even worse when competitors report growth over the same time period.
Keep in mind that we’re only talking about a single quarter, and not a long-term trend. It’s too early to say whether Netflix is actually losing ground, though the company has warned it could shed another 2 million subscribers by July.
Next is account sharing, which according to Netflix, amounts to 100 million non-paying households. This is spread out across the entire world, but if we use the company’s U.S. pricing as a benchmark, it translates to between $1 to $2 billion in lost revenue.
Growth is Everything
In the tech sector, growth is everything. If Netflix can’t return to posting consecutive quarters of subscriber growth, it could be many years before the stock returns to its previous high.
“We’ve definitely seen that once you get to 70, 80 millions of subs, things really tend to slow down. We saw it with HBO, and we’ve seen the same issues with Disney. They’re hitting the upper limit on the big growth.”
– David Campo, NYU
Regaining that momentum is going to be difficult, but Netflix does have plans. To address password sharing, the service may charge a fee for out-of-household profiles that are added to an account. The specifics around enforcement are vague, but Netflix is also considering a lower-priced subscription plan that includes advertising.
Only time will tell if these strategies can stop the bleeding, or perhaps even boost profitability. Rampant inflation, which might persuade consumers to cut down on their subscriptions, could be a source of additional headwinds.


Markets
The European Stock Market: Attractive Valuations Offer Opportunities
On average, the European stock market has valuations that are nearly 50% lower than U.S. valuations. But how can you access the market?


European Stock Market: Attractive Valuations Offer Opportunities
Europe is known for some established brands, from L’Oréal to Louis Vuitton. However, the European stock market offers additional opportunities that may be lesser known.
The above infographic, sponsored by STOXX, outlines why investors may want to consider European stocks.
Attractive Valuations
Compared to most North American and Asian markets, European stocks offer lower or comparable valuations.
| Index | Price-to-Earnings Ratio | Price-to-Book Ratio |
|---|---|---|
| EURO STOXX 50 | 14.9 | 2.2 |
| STOXX Europe 600 | 14.4 | 2 |
| U.S. | 25.9 | 4.7 |
| Canada | 16.1 | 1.8 |
| Japan | 15.4 | 1.6 |
| Asia Pacific ex. China | 17.1 | 1.8 |
Data as of February 29, 2024. See graphic for full index names. Ratios based on trailing 12 month financials. The price to earnings ratio excludes companies with negative earnings.
On average, European valuations are nearly 50% lower than U.S. valuations, potentially offering an affordable entry point for investors.
Research also shows that lower price ratios have historically led to higher long-term returns.
Market Movements Not Closely Connected
Over the last decade, the European stock market had low-to-moderate correlation with North American and Asian equities.
The below chart shows correlations from February 2014 to February 2024. A value closer to zero indicates low correlation, while a value of one would indicate that two regions are moving in perfect unison.
| EURO STOXX 50 | STOXX EUROPE 600 | U.S. | Canada | Japan | Asia Pacific ex. China |
|
|---|---|---|---|---|---|---|
| EURO STOXX 50 | 1.00 | 0.97 | 0.55 | 0.67 | 0.24 | 0.43 |
| STOXX EUROPE 600 | 1.00 | 0.56 | 0.71 | 0.28 | 0.48 | |
| U.S. | 1.00 | 0.73 | 0.12 | 0.25 | ||
| Canada | 1.00 | 0.22 | 0.40 | |||
| Japan | 1.00 | 0.88 | ||||
| Asia Pacific ex. China | 1.00 |
Data is based on daily USD returns.
European equities had relatively independent market movements from North American and Asian markets. One contributing factor could be the differing sector weights in each market. For instance, technology makes up a quarter of the U.S. market, but health care and industrials dominate the broader European market.
Ultimately, European equities can enhance portfolio diversification and have the potential to mitigate risk for investors.
Tracking the Market
For investors interested in European equities, STOXX offers a variety of flagship indices:
| Index | Description | Market Cap |
|---|---|---|
| STOXX Europe 600 | Pan-regional, broad market | €10.5T |
| STOXX Developed Europe | Pan-regional, broad-market | €9.9T |
| STOXX Europe 600 ESG-X | Pan-regional, broad market, sustainability focus | €9.7T |
| STOXX Europe 50 | Pan-regional, blue-chip | €5.1T |
| EURO STOXX 50 | Eurozone, blue-chip | €3.5T |
Data is as of February 29, 2024. Market cap is free float, which represents the shares that are readily available for public trading on stock exchanges.
The EURO STOXX 50 tracks the Eurozone’s biggest and most traded companies. It also underlies one of the world’s largest ranges of ETFs and mutual funds. As of November 2023, there were €27.3 billion in ETFs and €23.5B in mutual fund assets under management tracking the index.
“For the past 25 years, the EURO STOXX 50 has served as an accurate, reliable and tradable representation of the Eurozone equity market.”
— Axel Lomholt, General Manager at STOXX
Partnering with STOXX to Track the European Stock Market
Are you interested in European equities? STOXX can be a valuable partner:
- Comprehensive, liquid and investable ecosystem
- European heritage, global reach
- Highly sophisticated customization capabilities
- Open architecture approach to using data
- Close partnerships with clients
- Part of ISS STOXX and Deutsche Börse Group
With a full suite of indices, STOXX can help you benchmark against the European stock market.
Learn how STOXX’s European indices offer liquid and effective market access.

-

 Economy1 day ago
Economic Growth Forecasts for G7 and BRICS Countries in 2024
The IMF has released its economic growth forecasts for 2024. How do the G7 and BRICS countries compare?
-

 Markets1 week ago
U.S. Debt Interest Payments Reach $1 Trillion
U.S. debt interest payments have surged past the $1 trillion dollar mark, amid high interest rates and an ever-expanding debt burden.
-

 United States2 weeks ago
Ranked: The Largest U.S. Corporations by Number of Employees
We visualized the top U.S. companies by employees, revealing the massive scale of retailers like Walmart, Target, and Home Depot.
-

 Markets2 weeks ago
The Top 10 States by Real GDP Growth in 2023
This graphic shows the states with the highest real GDP growth rate in 2023, largely propelled by the oil and gas boom.
-

 Markets2 weeks ago
Ranked: The World’s Top Flight Routes, by Revenue
In this graphic, we show the highest earning flight routes globally as air travel continued to rebound in 2023.
-

 Markets2 weeks ago
Ranked: The Most Valuable Housing Markets in America
The U.S. residential real estate market is worth a staggering $47.5 trillion. Here are the most valuable housing markets in the country.


-

 Mining1 week ago
Gold vs. S&P 500: Which Has Grown More Over Five Years?
-
Markets2 weeks ago
Ranked: The Most Valuable Housing Markets in America
-

 Money2 weeks ago
Which States Have the Highest Minimum Wage in America?
-

 AI2 weeks ago
Ranked: Semiconductor Companies by Industry Revenue Share
-
Markets2 weeks ago
Ranked: The World’s Top Flight Routes, by Revenue
-

 Demographics2 weeks ago
Population Projections: The World’s 6 Largest Countries in 2075
-
Markets2 weeks ago
The Top 10 States by Real GDP Growth in 2023
-

 Demographics2 weeks ago
The Smallest Gender Wage Gaps in OECD Countries