Datastream
Who are the Longest Serving Active CEOs in the S&P 500?
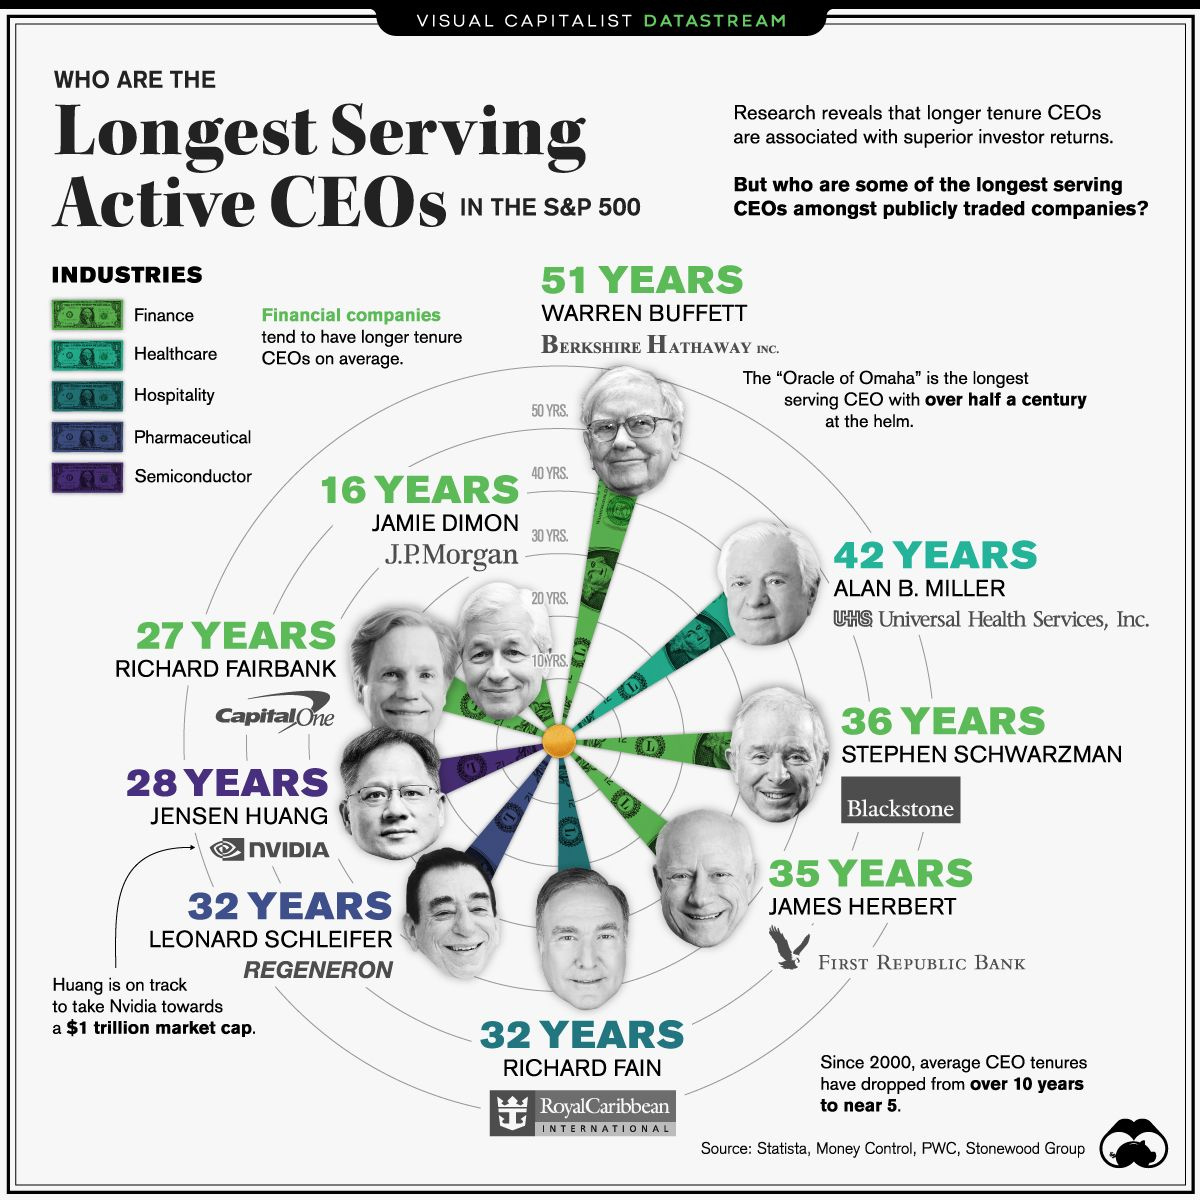


The Briefing
- The longest serving CEOs highlighted have remained in their position for an average of 33 years
- The best performing CEOs in 2019 held their jobs for 2x the average duration of S&P 500 CEOs
Who are the Longest Serving Active CEOs in the S&P 500?
Have you ever wondered which chief executive officer has remained at their position the longest? As an investor, you might be interested to know that studies have linked CEO duration with superior stock returns.
One study in particular from the University of Sydney looked at some 19,000 CEOs across the NYSE and NASDAQ from 1992-2016 and concluded:
“A one year increase in CEO tenure, on average, increases future stock returns by 0.029 percentage points, and suggests that longer CEO tenure has robust positive predictive power on cross-sectional stock returns.”
The data in this piece highlights several of the most tenured CEOs in the S&P 500. Warren Buffett is the longest serving leader of the bunch, having maintained his position for over half a century.
| CEO | Duration | Company |
|---|---|---|
| Warren Buffet | 51 years (since1970) | Berkshire Hathaway |
| Alan B. Miller | 42 years (since 1979) | Universal Health Services |
| Stephen Schwarzman | 36 years (since 1985) | Blackstone Group |
| James Herbert | 35 years (since 1986) | First Republic Bank |
| Richard Fain | 32 years (since 1988) | Royal Caribbean Cruises |
| Leonard Schleifer | 32 years (since 1988) | Regeneron |
| Jensen Huang | 28 years (since 1993) | Nvidia |
| Richard Fairbank | 27 years (since 1994) | Capital One |
| Jamie Dimon | 16 years (since 2005) | JP Morgan |
Depending on your investment style, who the CEO is can be an important consideration. Fundamental-oriented investors frequently size up a management team as a key step in evaluating the future prospects of a company.
The Top CEOs
A few of the longest serving CEOs are some of the top rated in the world as well. This table below shows where Warren Buffett, Jamie Dimon, and Jensen Huang appear and rank, in various business magazines and reports:
| CEO | Must Influential CEOs CEO World Magazine | Top 100 CEOs Glassdoor | Top 50 CEOs CEO Today Magazine |
|---|---|---|---|
| Jamie Dimon (JP Morgan) | #6 | N/A | #17 |
| Warren Buffett (Berkshire Hathaway) | #20 | N/A | #10 |
| Jensen Huang (Nvidia) | #60 | #31 | #19 |
Jensen Huang, in particular, has gained a ton of popularity due to Nvidia’s impressive growth and performance. Their $816 billion market cap means Huang oversees the largest company of this group. In fact, a 23% further increase in their share price would launch Nvidia into the elite trillion dollar club, a fairly small gain when contrasted to their 1,250% share price increase during the last five years.
CEO Duration and Performance
The data on CEO performance is often contingent on how long they last in the role. An HBR report took a look at the performance of 747 S&P 500 CEOs and has some surprising insights. For example, the best performance period for CEOs tends to come in the 2nd decade in years 11-15, otherwise known as “The Golden Years” stage.
Unfortunately, a lot of CEOs don’t make it long enough to enjoy their golden years. PWC found that CEO turnover has become increasingly more rapid relative to the past. Consider that turnover among CEOs at the world’s 2,500 largest companies soared to a record high of 17.5% just a few years ago. Furthermore, median tenures for CEOs have steadily dipped from a 10-year average in 2000, to 8 years in 2016, and closer to 5 in more recent times.
If recent trends and patterns are any indication, long-term serving CEOs like those highlighted above will become even more rare.
Where does this data come from?
Source: Statista, Money Control, PWC, HBR
Notes: CEO duration data does not include specific date or month joined


Datastream
Can You Calculate Your Daily Carbon Footprint?
Discover how the average person’s carbon footprint impacts the environment and learn how carbon credits can offset your carbon footprint.


The Briefing
- A person’s carbon footprint is substantial, with activities such as food consumption creating as much as 4,500 g of CO₂ emissions daily.
- By purchasing carbon credits from Carbon Streaming Corporation, you can offset your own emissions and fund positive climate action.
Your Everyday Carbon Footprint
While many large businesses and countries have committed to net-zero goals, it is essential to acknowledge that your everyday activities also contribute to global emissions.
In this graphic, sponsored by Carbon Streaming Corporation, we will explore how the choices we make and the products we use have a profound impact on our carbon footprint.
Carbon Emissions by Activity
Here are some of the daily activities and products of the average person and their carbon footprint, according to Clever Carbon.
| Household Activities & Products | CO2 Emissions (g) |
|---|---|
| 💡 Standard Light Bulb (100 watts, four hours) | 172 g |
| 📱 Mobile Phone Use (195 minutes per day)* | 189 g |
| 👕 Washing Machine (0.63 kWh) | 275 g |
| 🔥 Electric Oven (1.56 kWh) | 675 g |
| ♨️ Tumble Dryer (2.5 kWh) | 1,000 g |
| 🧻 Toilet Roll (2 ply) | 1,300 g |
| 🚿 Hot Shower (10 mins) | 2,000 g |
| 🚙 Daily Commute (one hour, by car) | 3,360 g |
| 🍽️ Average Daily Food Consumption (three meals of 600 calories) | 4,500 g |
| *Phone use based on yearly use of 69kg per the source, Reboxed | |
Your choice of transportation plays a crucial role in determining your carbon footprint. For instance, a 15 km daily commute to work on public transport generates an average of 1,464 g of CO₂ emissions. Compared to 3,360 g—twice the volume for a journey the same length by car.
By opting for more sustainable modes of transport, such as cycling, walking, or public transportation, you can significantly reduce your carbon footprint.
Addressing Your Carbon Footprint
One way to compensate for your emissions is by purchasing high-quality carbon credits.
Carbon credits are used to help fund projects that avoid, reduce or remove CO₂ emissions. This includes nature-based solutions such as reforestation and improved forest management, or technology-based solutions such as the production of biochar and carbon capture and storage (CCS).
While carbon credits offer a potential solution for individuals to help reduce global emissions, public awareness remains a significant challenge. A BCG-Patch survey revealed that only 34% of U.S. consumers are familiar with carbon credits, and only 3% have purchased them in the past.
About Carbon Streaming
By financing the creation or expansion of carbon projects, Carbon Streaming Corporation secures the rights to future carbon credits generated by these sustainable projects. You can then purchase these carbon credits to help fund climate solutions around the world and compensate for your own emissions.
Ready to get involved?
>> Learn more about purchasing carbon credits at Carbon Streaming

-

 Misc1 week ago
How Hard Is It to Get Into an Ivy League School?
-

 Technology2 weeks ago
Ranked: Semiconductor Companies by Industry Revenue Share
-

 Markets2 weeks ago
Ranked: The World’s Top Flight Routes, by Revenue
-

 Countries2 weeks ago
Population Projections: The World’s 6 Largest Countries in 2075
-

 Markets2 weeks ago
The Top 10 States by Real GDP Growth in 2023
-

 Demographics2 weeks ago
The Smallest Gender Wage Gaps in OECD Countries
-

 United States2 weeks ago
Where U.S. Inflation Hit the Hardest in March 2024
-

 Green2 weeks ago
Top Countries By Forest Growth Since 2001