Datastream
The Top 10 Semiconductor Companies by Market Share


The Briefing
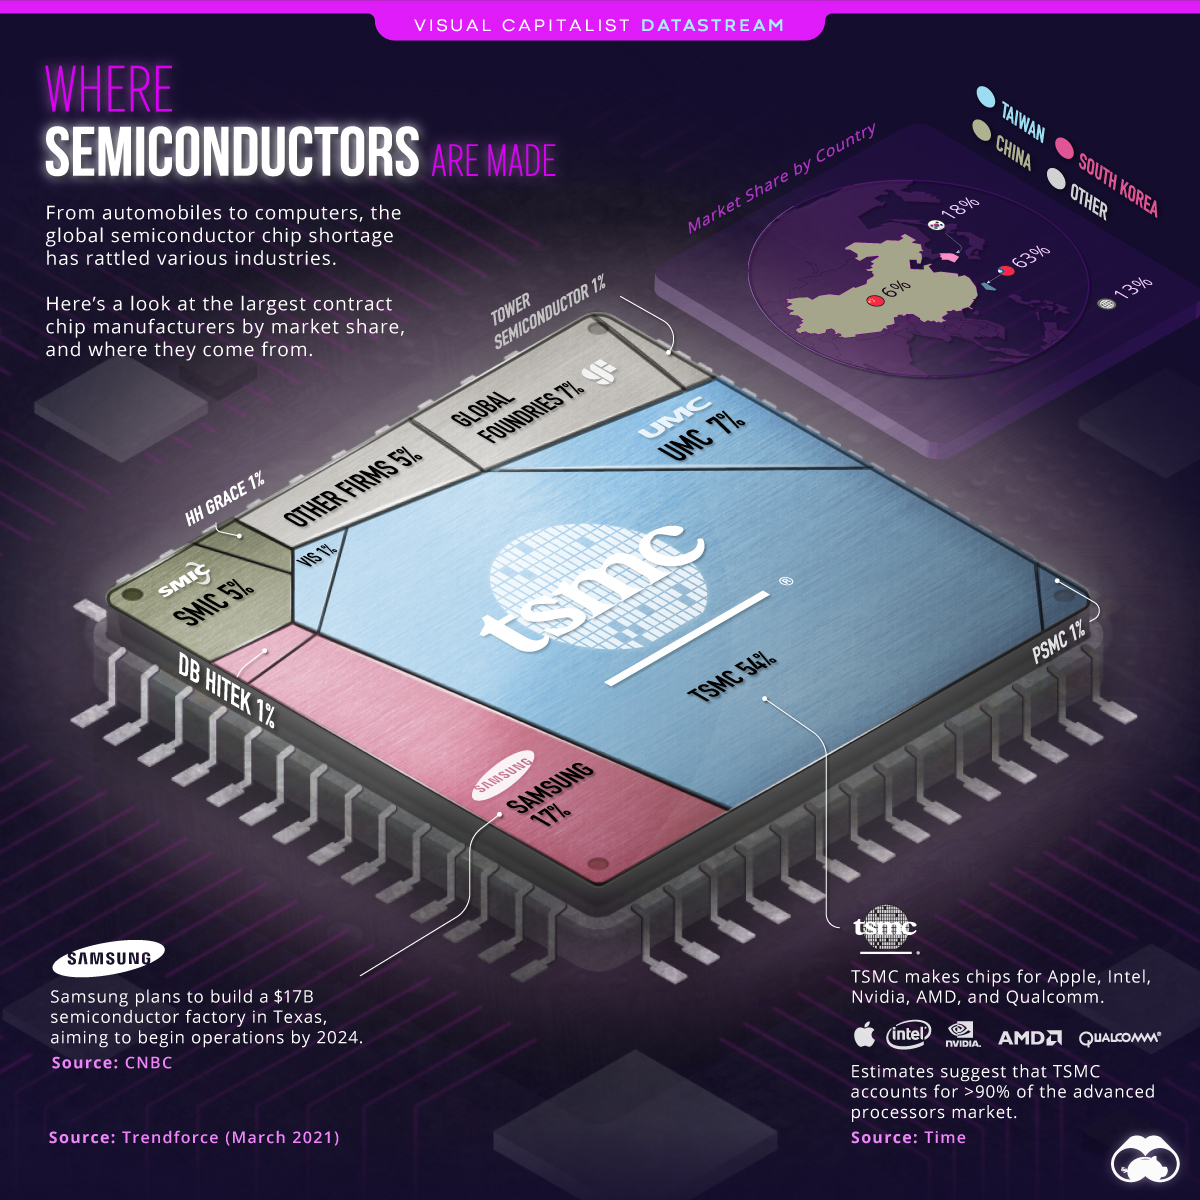
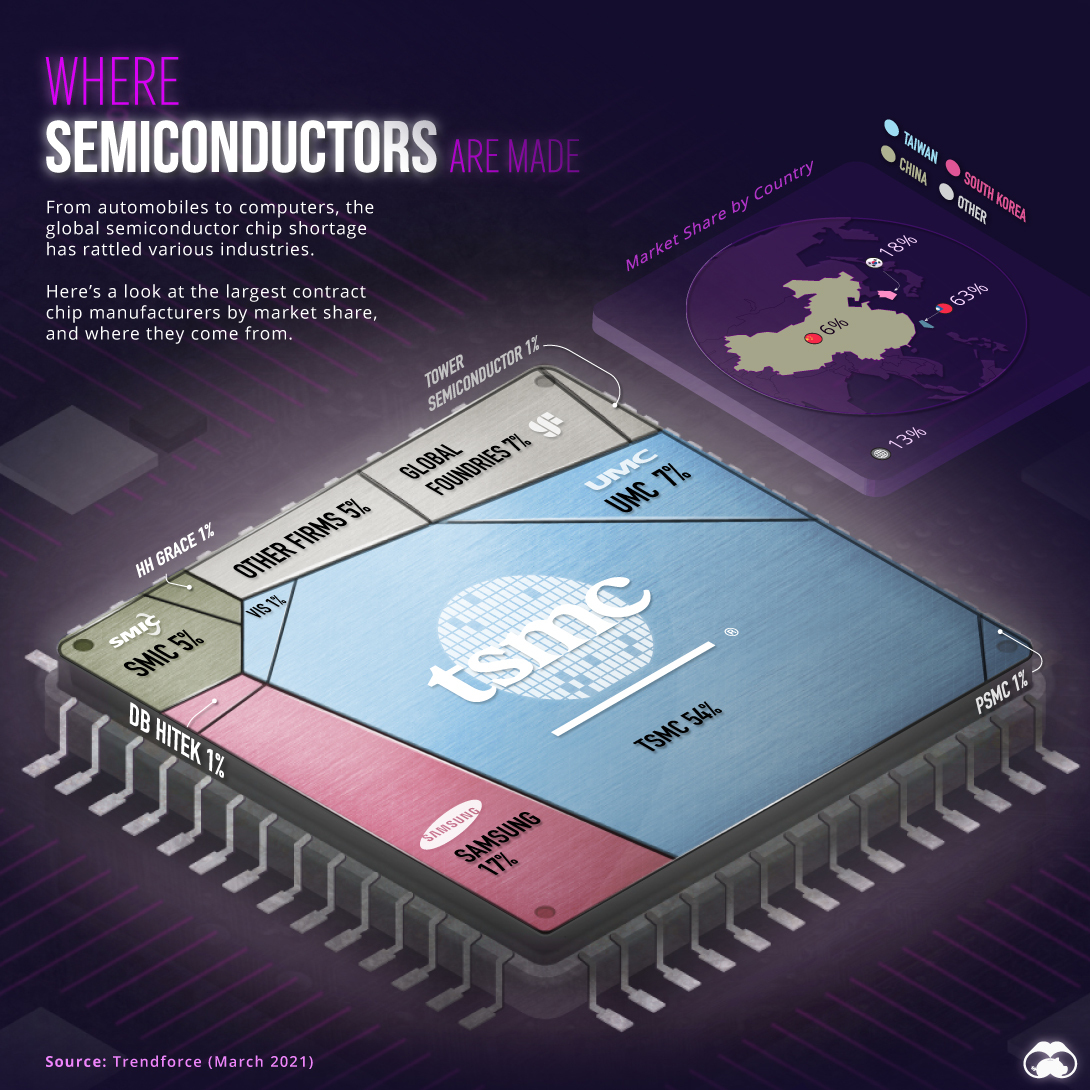
- Taiwan Semiconductor Manufacturing Co. accounts for 54% of the global market share
- Taiwan, South Korea, and China combine for 87% of the global semiconductor market
The Top 10 Semiconductor Companies by Market Share
Semiconductors are an essential component of the microchips that power virtually every modern electronic device. As the objects around us get “smarter” and demand for electronics grows around the world, the demand for semiconductors will continue to skyrocket.
So, which companies currently make these chips, and where are they located?
The above infographic uses data from TrendForce to break down the top 10 semiconductor companies by country and market share.
The Biggest Semiconductor Companies
Before diving into the companies, it’s important to have context on their business. Also known as foundries, these semiconductor companies specialize in the fabrication or production of chips. “Fabless” chip makers—companies that design their chips and supply hardware but do not have fabrication plants—outsource chip production to foundries, primarily in Asia.
Taiwan, China, and South Korea combine for roughly 87% of the global foundry market. Here’s how it breaks down:
| Company | Market share | Country |
|---|---|---|
| TSMC | 54% | Taiwan 🇹🇼 |
| Samsung | 17% | South Korea 🇰🇷 |
| UMC | 7% | Taiwan 🇹🇼 |
| GlobalFoundries | 7% | U.S. 🇺🇸 |
| SMIC | 5% | China 🇨🇳 |
| HH Grace | 1% | China 🇨🇳 |
| PSMC | 1% | Taiwan 🇹🇼 |
| VIS | 1% | Taiwan 🇹🇼 |
| DB HiTek | 1% | China 🇨🇳 |
| Tower Semiconductor | 1% | Israel 🇮🇱 |
| Other firms | 5% | N/A |
TSMC, short for Taiwan Semiconductor Manufacturing Company, is by far the world’s largest chip manufacturer. It’s also the sixth most valuable company in the world with a market cap of over $600 billion, and supplies chips to the likes of Apple, Intel, and Nvidia.
TSMC and Samsung are the only companies capable of producing today’s most advanced 5-nanometer chips that go into iPhones. However, the Taiwanese company is one step ahead and set to produce its 3-nanometer chips in 2022, offering the most advanced foundry technology.
Other companies on the list include China’s largest chipmaker SMIC, one of the 60 Chinese companies blacklisted by the U.S. in 2020. On a country level, Taiwan accounts for 63% of the foundry market, followed by South Korea with 18%. In both countries, the majority of the market share belongs to a single company.
The 2021 Semiconductor Shortage
With the adoption of 5G devices and other new technologies, chips have been in high demand.
While pandemic-induced shutdowns have hampered supply, the demand for chips has continued surging with reopening economies. The resulting chip shortage has rattled several industries with lead times—the gap between when a semiconductor is ordered and when it is delivered is at a record high of 22 weeks.
The chip shortage is a boon to semiconductor companies, but downstream firms are struggling. Global automakers are set to make 7.7 million fewer cars in 2021, which translates into a $210 billion hit to their revenues. Consumer electronics have taken a blow as well, with popular products like the Playstation 5 console in short supply.
New chip factories take years to build, in addition to billions of dollars. With many analysts expecting the shortage to last through 2023, it’ll be interesting to see how chipmakers respond, especially if demand continues to rise.
Where does this data come from?
Source: TrendForce


Datastream
Can You Calculate Your Daily Carbon Footprint?
Discover how the average person’s carbon footprint impacts the environment and learn how carbon credits can offset your carbon footprint.


The Briefing
- A person’s carbon footprint is substantial, with activities such as food consumption creating as much as 4,500 g of CO₂ emissions daily.
- By purchasing carbon credits from Carbon Streaming Corporation, you can offset your own emissions and fund positive climate action.
Your Everyday Carbon Footprint
While many large businesses and countries have committed to net-zero goals, it is essential to acknowledge that your everyday activities also contribute to global emissions.
In this graphic, sponsored by Carbon Streaming Corporation, we will explore how the choices we make and the products we use have a profound impact on our carbon footprint.
Carbon Emissions by Activity
Here are some of the daily activities and products of the average person and their carbon footprint, according to Clever Carbon.
| Household Activities & Products | CO2 Emissions (g) |
|---|---|
| 💡 Standard Light Bulb (100 watts, four hours) | 172 g |
| 📱 Mobile Phone Use (195 minutes per day)* | 189 g |
| 👕 Washing Machine (0.63 kWh) | 275 g |
| 🔥 Electric Oven (1.56 kWh) | 675 g |
| ♨️ Tumble Dryer (2.5 kWh) | 1,000 g |
| 🧻 Toilet Roll (2 ply) | 1,300 g |
| 🚿 Hot Shower (10 mins) | 2,000 g |
| 🚙 Daily Commute (one hour, by car) | 3,360 g |
| 🍽️ Average Daily Food Consumption (three meals of 600 calories) | 4,500 g |
| *Phone use based on yearly use of 69kg per the source, Reboxed | |
Your choice of transportation plays a crucial role in determining your carbon footprint. For instance, a 15 km daily commute to work on public transport generates an average of 1,464 g of CO₂ emissions. Compared to 3,360 g—twice the volume for a journey the same length by car.
By opting for more sustainable modes of transport, such as cycling, walking, or public transportation, you can significantly reduce your carbon footprint.
Addressing Your Carbon Footprint
One way to compensate for your emissions is by purchasing high-quality carbon credits.
Carbon credits are used to help fund projects that avoid, reduce or remove CO₂ emissions. This includes nature-based solutions such as reforestation and improved forest management, or technology-based solutions such as the production of biochar and carbon capture and storage (CCS).
While carbon credits offer a potential solution for individuals to help reduce global emissions, public awareness remains a significant challenge. A BCG-Patch survey revealed that only 34% of U.S. consumers are familiar with carbon credits, and only 3% have purchased them in the past.
About Carbon Streaming
By financing the creation or expansion of carbon projects, Carbon Streaming Corporation secures the rights to future carbon credits generated by these sustainable projects. You can then purchase these carbon credits to help fund climate solutions around the world and compensate for your own emissions.
Ready to get involved?
>> Learn more about purchasing carbon credits at Carbon Streaming

-

 Real Estate2 weeks ago
Visualizing America’s Shortage of Affordable Homes
-

 Technology1 week ago
Ranked: Semiconductor Companies by Industry Revenue Share
-

 Money1 week ago
Which States Have the Highest Minimum Wage in America?
-

 Real Estate1 week ago
Ranked: The Most Valuable Housing Markets in America
-

 Business2 weeks ago
Charted: Big Four Market Share by S&P 500 Audits
-

 AI2 weeks ago
The Stock Performance of U.S. Chipmakers So Far in 2024
-

 Misc2 weeks ago
Almost Every EV Stock is Down After Q1 2024
-

 Money2 weeks ago
Where Does One U.S. Tax Dollar Go?