Datastream
The Decline of Long-Term Investing


The Briefing
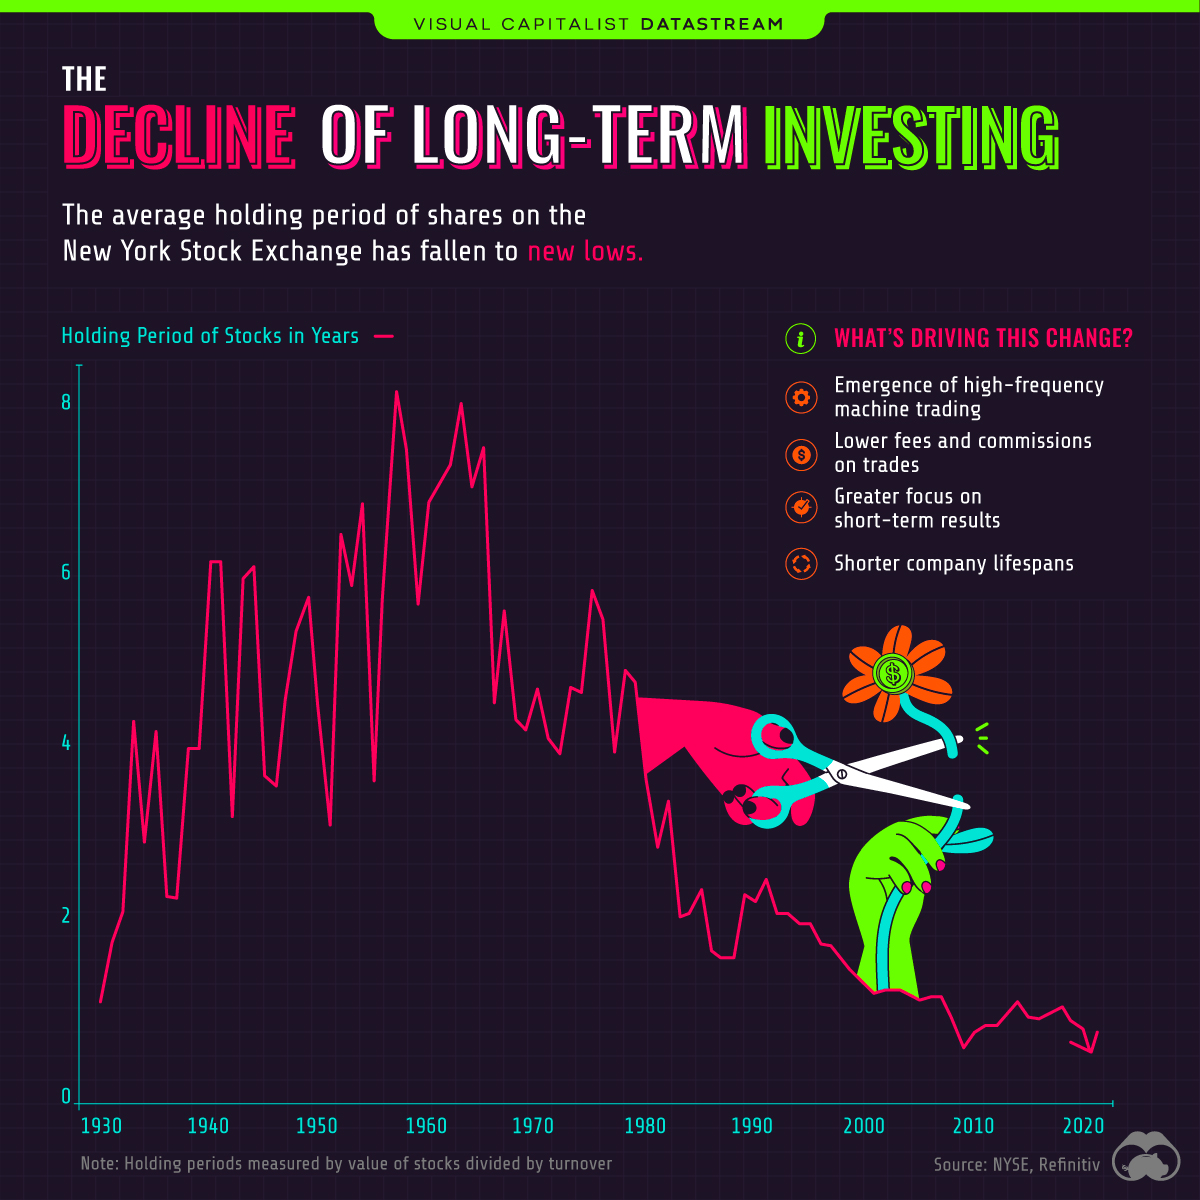
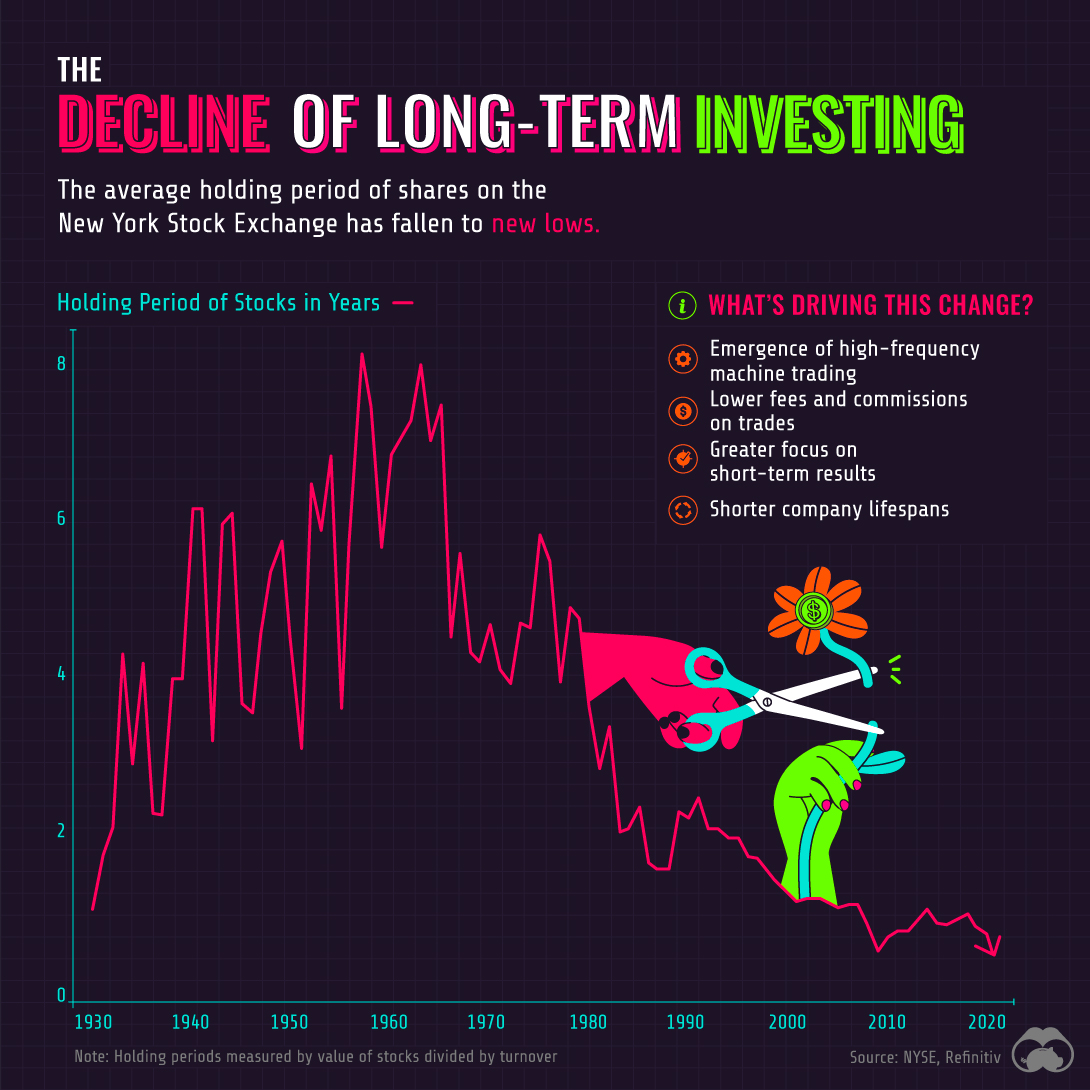
- The average holding period of shares on the New York Stock Exchange (NYSE) is now <1 year
- Technological advancement is one of the biggest drivers of this change
The Decline of Long-Term Investing
“Our favorite holding period is forever.”
Those are words from famed investor Warren Buffett, an advocate of the buy and hold approach to investing. Buy and hold is a long-term strategy in which shares are gradually accumulated over time, regardless of short-term performance.
And while Buffett is undoubtedly a successful investor, data from the NYSE suggests that few are actually following his advice. As of June 2020, the average holding period of shares was just 5.5 months. That’s a massive decrease from the late 1950s peak of 8 years.
What’s Driving This Change?
The decline in holding periods appears to have been caused by a number of factors, with the most prominent one being technological advancement.
For example, in 1966, the NYSE switched to a fully automated trading system. This greatly increased the number of trades that could be processed each day and lowered the cost of transactions.
| Year | NYSE Average Daily Trading Volume* (number of shares) |
|---|---|
| 1886 | 1M |
| 1982 | 100M |
| 1987 | 500M |
| 2020 | 1,000M |
*10 day moving average as of Dec. 15, 2020. Source: Nasdaq
Automated exchanges have led to the introduction of high-frequency trading (HFT), which uses computer algorithms to analyze markets and execute trades within seconds. HFT represents 50% of trading volume in U.S. equity markets, making it a significant contributor to the decline in holding periods.
Technology has enabled investors to become more active as well. Thanks to the internet and smartphones, new information is widely distributed and easy to access. With online trading platforms, investors also have the ability to act on this information immediately.
Social media is also playing a role. The recent r/wallstreetbets saga is an example of how the stock market can become sensational and fad-driven. After all, long-term investing has much less to offer in terms of excitement.
Corporate Longevity in Decline
Finally, companies themselves are also exhibiting shorter lifespans. This results in greater index turnover (companies being added or removed from stock indexes), and is likely a contributor to the decline in holding periods.
In 1970, companies that were included in the S&P 500 had an average tenure of 35 years. By 2018, average tenure was down to 20 years, and by 2030, it’s expected to fall below 15 years.
Altogether, these trends may be creating a greater incentive to pursue short-term results.


Datastream
Can You Calculate Your Daily Carbon Footprint?
Discover how the average person’s carbon footprint impacts the environment and learn how carbon credits can offset your carbon footprint.


The Briefing
- A person’s carbon footprint is substantial, with activities such as food consumption creating as much as 4,500 g of CO₂ emissions daily.
- By purchasing carbon credits from Carbon Streaming Corporation, you can offset your own emissions and fund positive climate action.
Your Everyday Carbon Footprint
While many large businesses and countries have committed to net-zero goals, it is essential to acknowledge that your everyday activities also contribute to global emissions.
In this graphic, sponsored by Carbon Streaming Corporation, we will explore how the choices we make and the products we use have a profound impact on our carbon footprint.
Carbon Emissions by Activity
Here are some of the daily activities and products of the average person and their carbon footprint, according to Clever Carbon.
| Household Activities & Products | CO2 Emissions (g) |
|---|---|
| 💡 Standard Light Bulb (100 watts, four hours) | 172 g |
| 📱 Mobile Phone Use (195 minutes per day)* | 189 g |
| 👕 Washing Machine (0.63 kWh) | 275 g |
| 🔥 Electric Oven (1.56 kWh) | 675 g |
| ♨️ Tumble Dryer (2.5 kWh) | 1,000 g |
| 🧻 Toilet Roll (2 ply) | 1,300 g |
| 🚿 Hot Shower (10 mins) | 2,000 g |
| 🚙 Daily Commute (one hour, by car) | 3,360 g |
| 🍽️ Average Daily Food Consumption (three meals of 600 calories) | 4,500 g |
| *Phone use based on yearly use of 69kg per the source, Reboxed | |
Your choice of transportation plays a crucial role in determining your carbon footprint. For instance, a 15 km daily commute to work on public transport generates an average of 1,464 g of CO₂ emissions. Compared to 3,360 g—twice the volume for a journey the same length by car.
By opting for more sustainable modes of transport, such as cycling, walking, or public transportation, you can significantly reduce your carbon footprint.
Addressing Your Carbon Footprint
One way to compensate for your emissions is by purchasing high-quality carbon credits.
Carbon credits are used to help fund projects that avoid, reduce or remove CO₂ emissions. This includes nature-based solutions such as reforestation and improved forest management, or technology-based solutions such as the production of biochar and carbon capture and storage (CCS).
While carbon credits offer a potential solution for individuals to help reduce global emissions, public awareness remains a significant challenge. A BCG-Patch survey revealed that only 34% of U.S. consumers are familiar with carbon credits, and only 3% have purchased them in the past.
About Carbon Streaming
By financing the creation or expansion of carbon projects, Carbon Streaming Corporation secures the rights to future carbon credits generated by these sustainable projects. You can then purchase these carbon credits to help fund climate solutions around the world and compensate for your own emissions.
Ready to get involved?
>> Learn more about purchasing carbon credits at Carbon Streaming

-

 Mining1 week ago
Gold vs. S&P 500: Which Has Grown More Over Five Years?
-

 Markets2 weeks ago
Ranked: The Most Valuable Housing Markets in America
-

 Money2 weeks ago
Which States Have the Highest Minimum Wage in America?
-

 AI2 weeks ago
Ranked: Semiconductor Companies by Industry Revenue Share
-

 Markets2 weeks ago
Ranked: The World’s Top Flight Routes, by Revenue
-

 Countries2 weeks ago
Population Projections: The World’s 6 Largest Countries in 2075
-

 Markets2 weeks ago
The Top 10 States by Real GDP Growth in 2023
-

 Demographics2 weeks ago
The Smallest Gender Wage Gaps in OECD Countries