Energy
Visualizing the Scale of Global Fossil Fuel Production
![]() Subscribe to the Elements free mailing list for more like this
Subscribe to the Elements free mailing list for more like this


The Scale of Global Fossil Fuel Production
This was originally posted on Elements. Sign up to the free mailing list to get beautiful visualizations on natural resource megatrends in your email every week.
Fossil fuels have been our predominant source of energy for over a century, and the world still extracts and consumes a colossal amount of coal, oil, and gas every year.
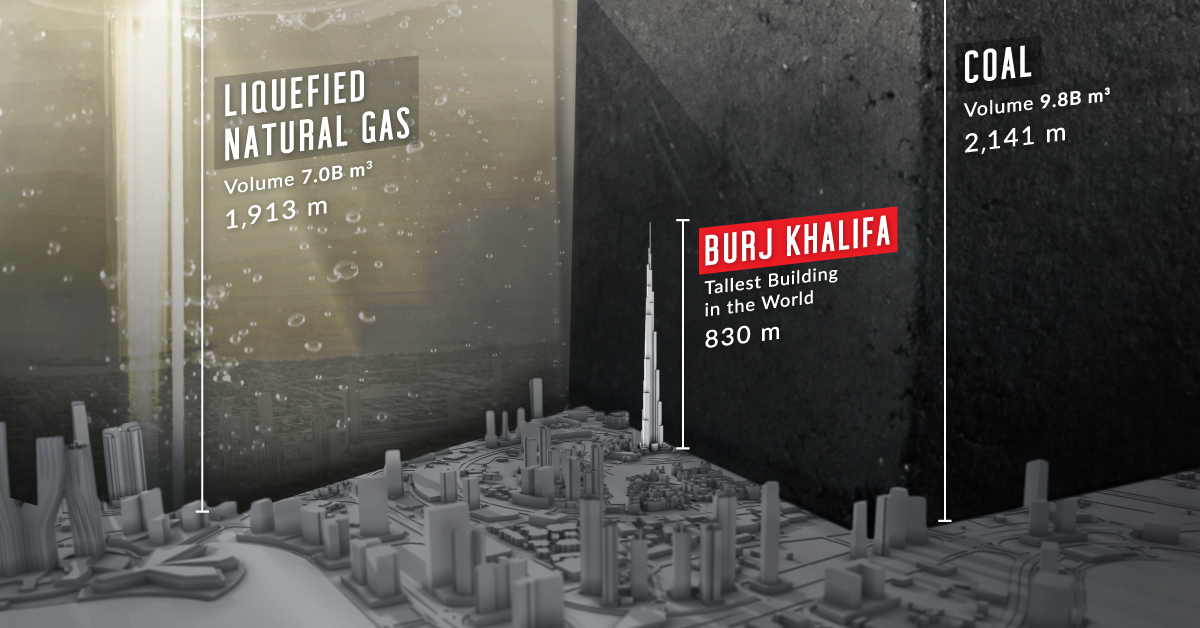
This infographic visualizes the volume of global fossil fuel production in 2021 using data from BP’s Statistical Review of World Energy.
The Facts on Fossil Fuels
In 2021, the world produced around 8 billion tonnes of coal, 4 billion tonnes of oil, and over 4 trillion cubic meters of natural gas.
Most of the coal is used to generate electricity for our homes and offices and has a key role in steel production. Similarly, natural gas is a large source of electricity and heat for industries and buildings. Oil is primarily used by the transportation sector, in addition to petrochemical manufacturing, heating, and other end uses.
Here’s a full breakdown of coal, oil, and gas production by country in 2021.
Coal Production
If all the coal produced in 2021 were arranged in a cube, it would measure 2,141 meters (2.1km) on each side—more than 2.5 times the height of the world’s tallest building.
China produced 50% or more than four billion tonnes of the world’s coal in 2021. It’s also the largest consumer of coal, accounting for 54% of coal consumption in 2021.
| Rank | Country | 2021 Coal Production (million tonnes) | % of Total |
|---|---|---|---|
| #1 | 🇨🇳 China | 4,126.0 | 50% |
| #2 | 🇮🇳 India | 811.3 | 10% |
| #3 | 🇮🇩 Indonesia | 614.0 | 8% |
| #4 | 🇺🇸 U.S. | 524.4 | 6% |
| #5 | 🇦🇺 Australia | 478.6 | 6% |
| #6 | 🇷🇺 Russia | 433.7 | 5% |
| #7 | 🇿🇦 South Africa | 234.5 | 3% |
| #8 | 🇩🇪 Germany | 126.0 | 2% |
| #9 | 🇰🇿 Kazakhstan | 115.7 | 1% |
| #10 | 🇵🇱 Poland | 107.6 | 1% |
| 🌍 Other | 600.9 | 7% | |
| Total | 8,172.6 | 100% |
India is both the second largest producer and consumer of coal. Meanwhile, Indonesia is the world’s largest coal exporter, followed by Australia.
In the West, U.S. coal production was down 47% as compared to 2011 levels, and the descent is likely to continue with the clean energy transition.
Oil Production
In 2021, the United States, Russia, and Saudi Arabia were the three largest crude oil producers, respectively.
| Rank | Country | 2021 Oil Production (million tonnes) | % of Total |
|---|---|---|---|
| #1 | 🇺🇸 U.S. | 711.1 | 17% |
| #2 | 🇷🇺 Russia | 536.4 | 13% |
| #3 | 🇸🇦 Saudi Arabia | 515.0 | 12% |
| #4 | 🇨🇦 Canada | 267.1 | 6% |
| #5 | 🇮🇶 Iraq | 200.8 | 5% |
| #6 | 🇨🇳 China | 198.9 | 5% |
| #7 | 🇮🇷 Iran | 167.7 | 4% |
| #8 | 🇦🇪 UAE | 164.4 | 4% |
| #9 | 🇧🇷 Brazil | 156.8 | 4% |
| #10 | 🇰🇼 Kuwait | 131.1 | 3% |
| 🌍 Other | 1172.0 | 28% | |
| Total | 4221.4 | 100% |
OPEC countries, including Saudi Arabia, made up the largest share of production at 35% or 1.5 billion tonnes of oil.
U.S. oil production has seen significant growth since 2010. In 2021, the U.S. extracted 711 million tonnes of oil, more than double the 333 million tonnes produced in 2010.
Natural Gas Production
The world produced 4,036 billion cubic meters of natural gas in 2021. The above graphic converts that into an equivalent of seven billion cubic meters of liquefied natural gas (LNG) to visualize it on the same scale as oil and gas.
Here are the top 10 producers of natural gas in 2021:
| Rank | Country | 2021 Natural Gas Production (billion m3) | % of Total |
|---|---|---|---|
| #1 | 🇺🇸 U.S. | 934.2 | 23% |
| #2 | 🇷🇺 Russia | 701.7 | 17% |
| #3 | 🇮🇷 Iran | 256.7 | 6% |
| #4 | 🇨🇳 China | 209.2 | 5% |
| #5 | 🇶🇦 Qatar | 177.0 | 4% |
| #6 | 🇨🇦 Canada | 172.3 | 4% |
| #7 | 🇦🇺 Australia | 147.2 | 4% |
| #8 | 🇸🇦 Saudi Arabia | 117.3 | 3% |
| #9 | 🇳🇴 Norway | 114.3 | 3% |
| #10 | 🇩🇿 Algeria | 100.8 | 2% |
| 🌍 Other | 1106.3 | 27% | |
| Total | 4,036.9 | 100% |
The U.S. was the largest producer, with Texas and Pennsylvania accounting for 47% of its gas production. The U.S. electric power and industrial sectors account for around one-third of domestic natural gas consumption.
Russia, the next-largest producer, was the biggest exporter of gas in 2021. It exported an estimated 210 billion cubic meters of natural gas via pipelines to Europe and China. Around 80% of Russian natural gas comes from operations in the Arctic region.


Energy
Mapped: The Age of Energy Projects in Interconnection Queues, by State
This map shows how many energy projects are in interconnection queues by state and how long these projects have been queued up, on average.


Age of Energy Projects in Interconnection Queues, by State
This was originally posted on our Voronoi app. Download the app for free on iOS or Android and discover incredible data-driven charts from a variety of trusted sources.
By the end of 2023, more than 11,000 energy projects were in interconnection queues in the United States, waiting for a green-light from regional grid operators to proceed with construction.
This map, created in partnership with the National Public Utilities Council, maps out the average age of active energy projects in interconnection queues by state, using data from Berkeley Lab.
Interconnection Queues, Explained
Interconnection queues are lists of energy projects that have made interconnection requests to their regional grid operators. Once submitted, these requests formally initiate the impact study process that each project goes through before grid connection, forming waiting lists for approval known as interconnection queues.
In recent years, both the number and generation capacity of queued projects have surged in the United States, along with the length of time spent in queue.
According to Berkeley Lab, the amount of generation capacity entering queues each year has risen by more than 550% from 2015 to 2023, with average queue duration rising from 3 years to 5 years the same period.
As a result of the growing backlog, a large proportion of projects ultimately withdraw from queues, leading to only 19% of applications reaching commercial operations.
The Backlog: Number of Projects and Average Wait Times
Of the 11,000 active projects in U.S. queues at the end of 2023, Texas, California, and Virginia had the most in queue; 1,208, 947, and 743, respectively.
When looking at the average ages of these projects, all three states hovered around the national average of 34 months (2.83 years), with Texas sporting 28 months, California 33, and Virginia 34.
Vermont, Minnesota, Wisconsin, and Florida, on the other hand, had the highest average queue durations; 54, 49, 47, and 46 months, respectively.
Average Queue Duration by Project Type
At the end of 2023, more than 95% of the generation capacity in active interconnection queues was for emission-free resources. The table below provides a breakdown.
| Project Type | Average Queue Duration (As of 12/31/2023) | Number of Projects in Queue |
|---|---|---|
| Wind | 40 months | 841 |
| Solar | 34 months | 4,506 |
| Wind+Battery | 34 months | 76 |
| Solar+Battery | 27 months | 2,377 |
| Battery | 24 months | 2,818 |
Wind projects had the highest wait times at the end of 2023 with an average age of 40 months (3.33 years). Solar projects, on the other hand, made up more than 40% of projects in queue.
Overall, reducing the time that these renewable energy projects spend in queues can accelerate the transition to a low-carbon energy future.
According to the U.S. Department of Energy, enhancing data transparency, streamlining approval processes, promoting economic efficiency, and maintaining a reliable grid are some of the ways this growing backlog can be mitigated.

-

 Culture6 days ago
The World’s Top Media Franchises by All-Time Revenue
-

 Science2 weeks ago
Visualizing the Average Lifespans of Mammals
-

 Brands2 weeks ago
How Tech Logos Have Evolved Over Time
-

 Energy2 weeks ago
Ranked: The Top 10 EV Battery Manufacturers in 2023
-

 Countries2 weeks ago
Countries With the Largest Happiness Gains Since 2010
-

 Economy2 weeks ago
VC+: Get Our Key Takeaways From the IMF’s World Economic Outlook
-

 Demographics1 week ago
The Countries That Have Become Sadder Since 2010
-

 Money1 week ago
Charted: Who Has Savings in This Economy?