Technology
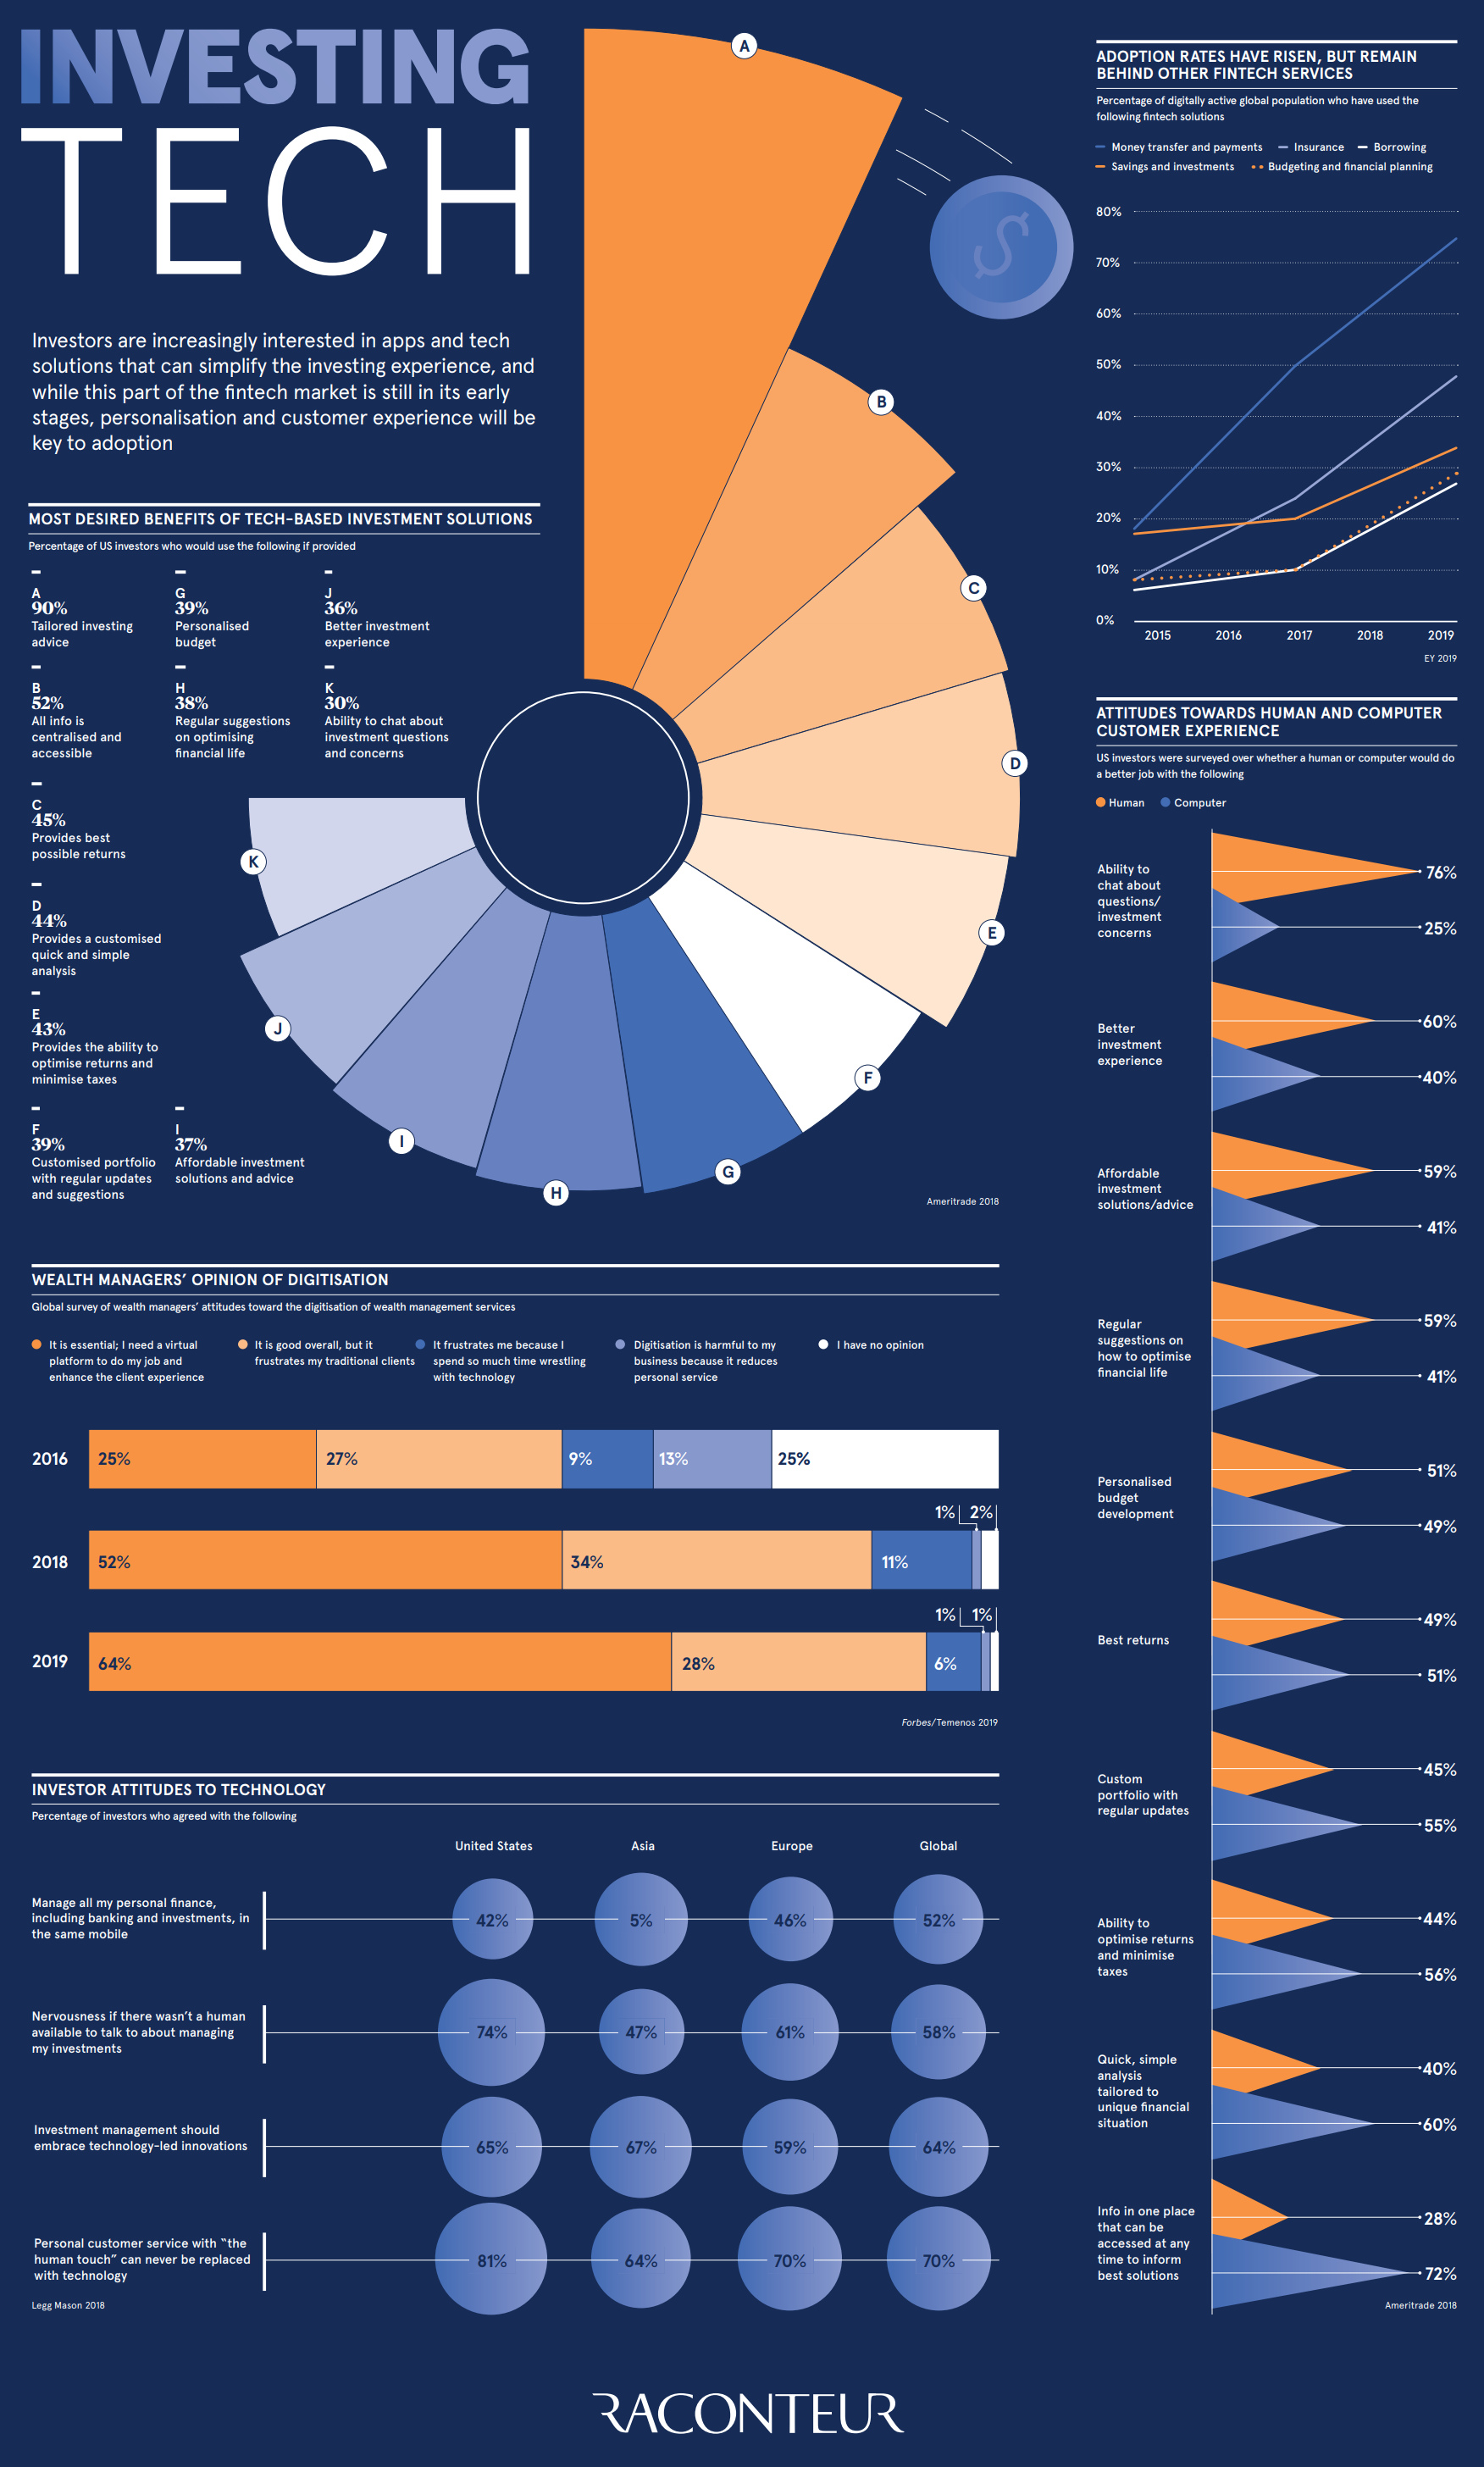
Visualizing the Rise of Investment Tech
View the full size version of this infographic
Visualizing the Rise of Investment Tech
For the high resolution version of this infographic, click here.
Investors and wealth managers are always looking to capitalize on their investments—and the latest innovations are arming them with more efficient tools to get there.
Fintech solutions are increasingly being adopted among the digitally active population, as 64% of surveyed wealth managers consider digitization essential in 2019.
Today’s graphic from Raconteur highlights the benefits of investment technology, and touches on shifting sentiments in human vs. digital interactions. Where do investors and wealth managers see the next epoch of investment fintech heading?
Fantastic Features: Top Benefits
According to a TD Ameritrade survey of 1,000 investors, a whopping 90% consider getting tailored investing advice to be the most important feature of any tech tool. In second place, 52% place value in easy access to their data.
Here are the other benefits at top of mind for investors when it comes to investment tech:
- 45% seek the best possible returns
- 44% look for customized, quick, and simple analysis
- 39% are interested in customized portfolios
- 39% want the benefit of personalized budgets
- 38% desire regular suggestions for optimizing financial health
But how well are these applications being adopted in everyday investment scenarios?
The Fintech Boom by the Numbers
Investment apps such as RobinHood have drastically risen in popularity, but still lag behind more mainstream segments in the fintech space:
Fintech Categories Ranked by Adoption Rate, 2015 to 2019
| Category | 2015 Adoption Rate | 2017 Adoption Rate | 2019 Adoption Rate |
|---|---|---|---|
| Money transfer and payments | 18% | 50% | 75% |
| Insurance | 8% | 24% | 48% |
| Savings and investments | 17% | 20% | 34% |
| Budgeting and financial planning | 8% | 10% | 29% |
| Borrowing | 6% | 10% | 27% |
Source: EY
Borrowing apps have the lowest global usage rates—only 27% of the digitally active global population—whereas nearly 75% have adopted money transfer and payment apps.
Human vs Machine: The Customer Experience
Do humans or machines have the edge in managing your investments?
The aforementioned survey by TD Ameritrade also asked investors which of the following are performed better by each group, with mixed results:
| 👨 Humans perceived as better | 🤖 Robots perceived as better | |
|---|---|---|
| • Ability to chat about questions or investment concerns | • Info in one place that can be accessed at any time to inform best solutions |
|
| • Investment experience | • Best returns | |
| • Affordable investment solutions or advice | • Ability to optimize returns and minimize taxes |
|
| • Regular suggestions on how to optimize financial life | • Quick, simple analysis tailored to unique financial situation |
|
| • Personalized budget development | • Custom portfolio with regular updates |
When it comes to managing tasks such as calculations, updates, and portfolio optimization, the majority of investors consider a computer to be better suited to the tasks at hand. However, when they are discussing investment concerns, personalization, or financial advice, the majority of customers prefer a human opinion.
Interestingly, 81% of U.S. investors believe that investment technology could never replace the “human touch”, compared to 70% of European investors or 64% in Asia.
Wealth Managers are Going Digital
Over time, wealth managers have grown to embrace the digitization of their industry.
The proportion of surveyed high-level executives who see digitization as essential to the industry jumped from just 25% in 2016 to 64% in 2019.
In another recent survey about views on most impactful types of fintech apps, more than 68% of wealth managers agreed that robo-advisors are among the most important developments, with AI-based investing apps following closely behind at 45%.
Towards a More Personalized Future
At the end of the day, investors want better, more personalized advice at their disposal—and for that advice to generate more profitable returns. Along with their wealth managers, investors are increasingly interested in solutions that can simplify portfolio management.
Digitization and automation of manual processes have been a welcome change for many industry professionals. While investment technology is still in early stages, wealth managers can personalize investor experiences through the adoption of tech─and increase their chances of future success by maintaining a seamless customer experience.


Technology
All of the Grants Given by the U.S. CHIPS Act
Intel, TSMC, and more have received billions in subsidies from the U.S. CHIPS Act in 2024.


All of the Grants Given by the U.S. CHIPS Act
This was originally posted on our Voronoi app. Download the app for free on iOS or Android and discover incredible data-driven charts from a variety of trusted sources.
This visualization shows which companies are receiving grants from the U.S. CHIPS Act, as of April 25, 2024. The CHIPS Act is a federal statute signed into law by President Joe Biden that authorizes $280 billion in new funding to boost domestic research and manufacturing of semiconductors.
The grant amounts visualized in this graphic are intended to accelerate the production of semiconductor fabrication plants (fabs) across the United States.
Data and Company Highlights
The figures we used to create this graphic were collected from a variety of public news sources. The Semiconductor Industry Association (SIA) also maintains a tracker for CHIPS Act recipients, though at the time of writing it does not have the latest details for Micron.
| Company | Federal Grant Amount | Anticipated Investment From Company |
|---|---|---|
| 🇺🇸 Intel | $8,500,000,000 | $100,000,000,000 |
| 🇹🇼 TSMC | $6,600,000,000 | $65,000,000,000 |
| 🇰🇷 Samsung | $6,400,000,000 | $45,000,000,000 |
| 🇺🇸 Micron | $6,100,000,000 | $50,000,000,000 |
| 🇺🇸 GlobalFoundries | $1,500,000,000 | $12,000,000,000 |
| 🇺🇸 Microchip | $162,000,000 | N/A |
| 🇬🇧 BAE Systems | $35,000,000 | N/A |
BAE Systems was not included in the graphic due to size limitations
Intel’s Massive Plans
Intel is receiving the largest share of the pie, with $8.5 billion in grants (plus an additional $11 billion in government loans). This grant accounts for 22% of the CHIPS Act’s total subsidies for chip production.
From Intel’s side, the company is expected to invest $100 billion to construct new fabs in Arizona and Ohio, while modernizing and/or expanding existing fabs in Oregon and New Mexico. Intel could also claim another $25 billion in credits through the U.S. Treasury Department’s Investment Tax Credit.
TSMC Expands its U.S. Presence
TSMC, the world’s largest semiconductor foundry company, is receiving a hefty $6.6 billion to construct a new chip plant with three fabs in Arizona. The Taiwanese chipmaker is expected to invest $65 billion into the project.
The plant’s first fab will be up and running in the first half of 2025, leveraging 4 nm (nanometer) technology. According to TrendForce, the other fabs will produce chips on more advanced 3 nm and 2 nm processes.
The Latest Grant Goes to Micron
Micron, the only U.S.-based manufacturer of memory chips, is set to receive $6.1 billion in grants to support its plans of investing $50 billion through 2030. This investment will be used to construct new fabs in Idaho and New York.

-

 Brands6 days ago
How Tech Logos Have Evolved Over Time
-

 Demographics2 weeks ago
The Smallest Gender Wage Gaps in OECD Countries
-

 Economy2 weeks ago
Where U.S. Inflation Hit the Hardest in March 2024
-

 Green2 weeks ago
Top Countries By Forest Growth Since 2001
-

 United States2 weeks ago
Ranked: The Largest U.S. Corporations by Number of Employees
-

 Maps2 weeks ago
The Largest Earthquakes in the New York Area (1970-2024)
-

 Green2 weeks ago
Ranked: The Countries With the Most Air Pollution in 2023
-

 Green2 weeks ago
Ranking the Top 15 Countries by Carbon Tax Revenue