Money
Visualizing Currencies’ Decline Against the U.S. Dollar
![]() Subscribe to the Elements free mailing list for more like this
Subscribe to the Elements free mailing list for more like this
Visualizing Currencies’ Decline Against the U.S. Dollar
This was originally posted on Elements. Sign up to the free mailing list to get beautiful visualizations on natural resource megatrends in your email every week.
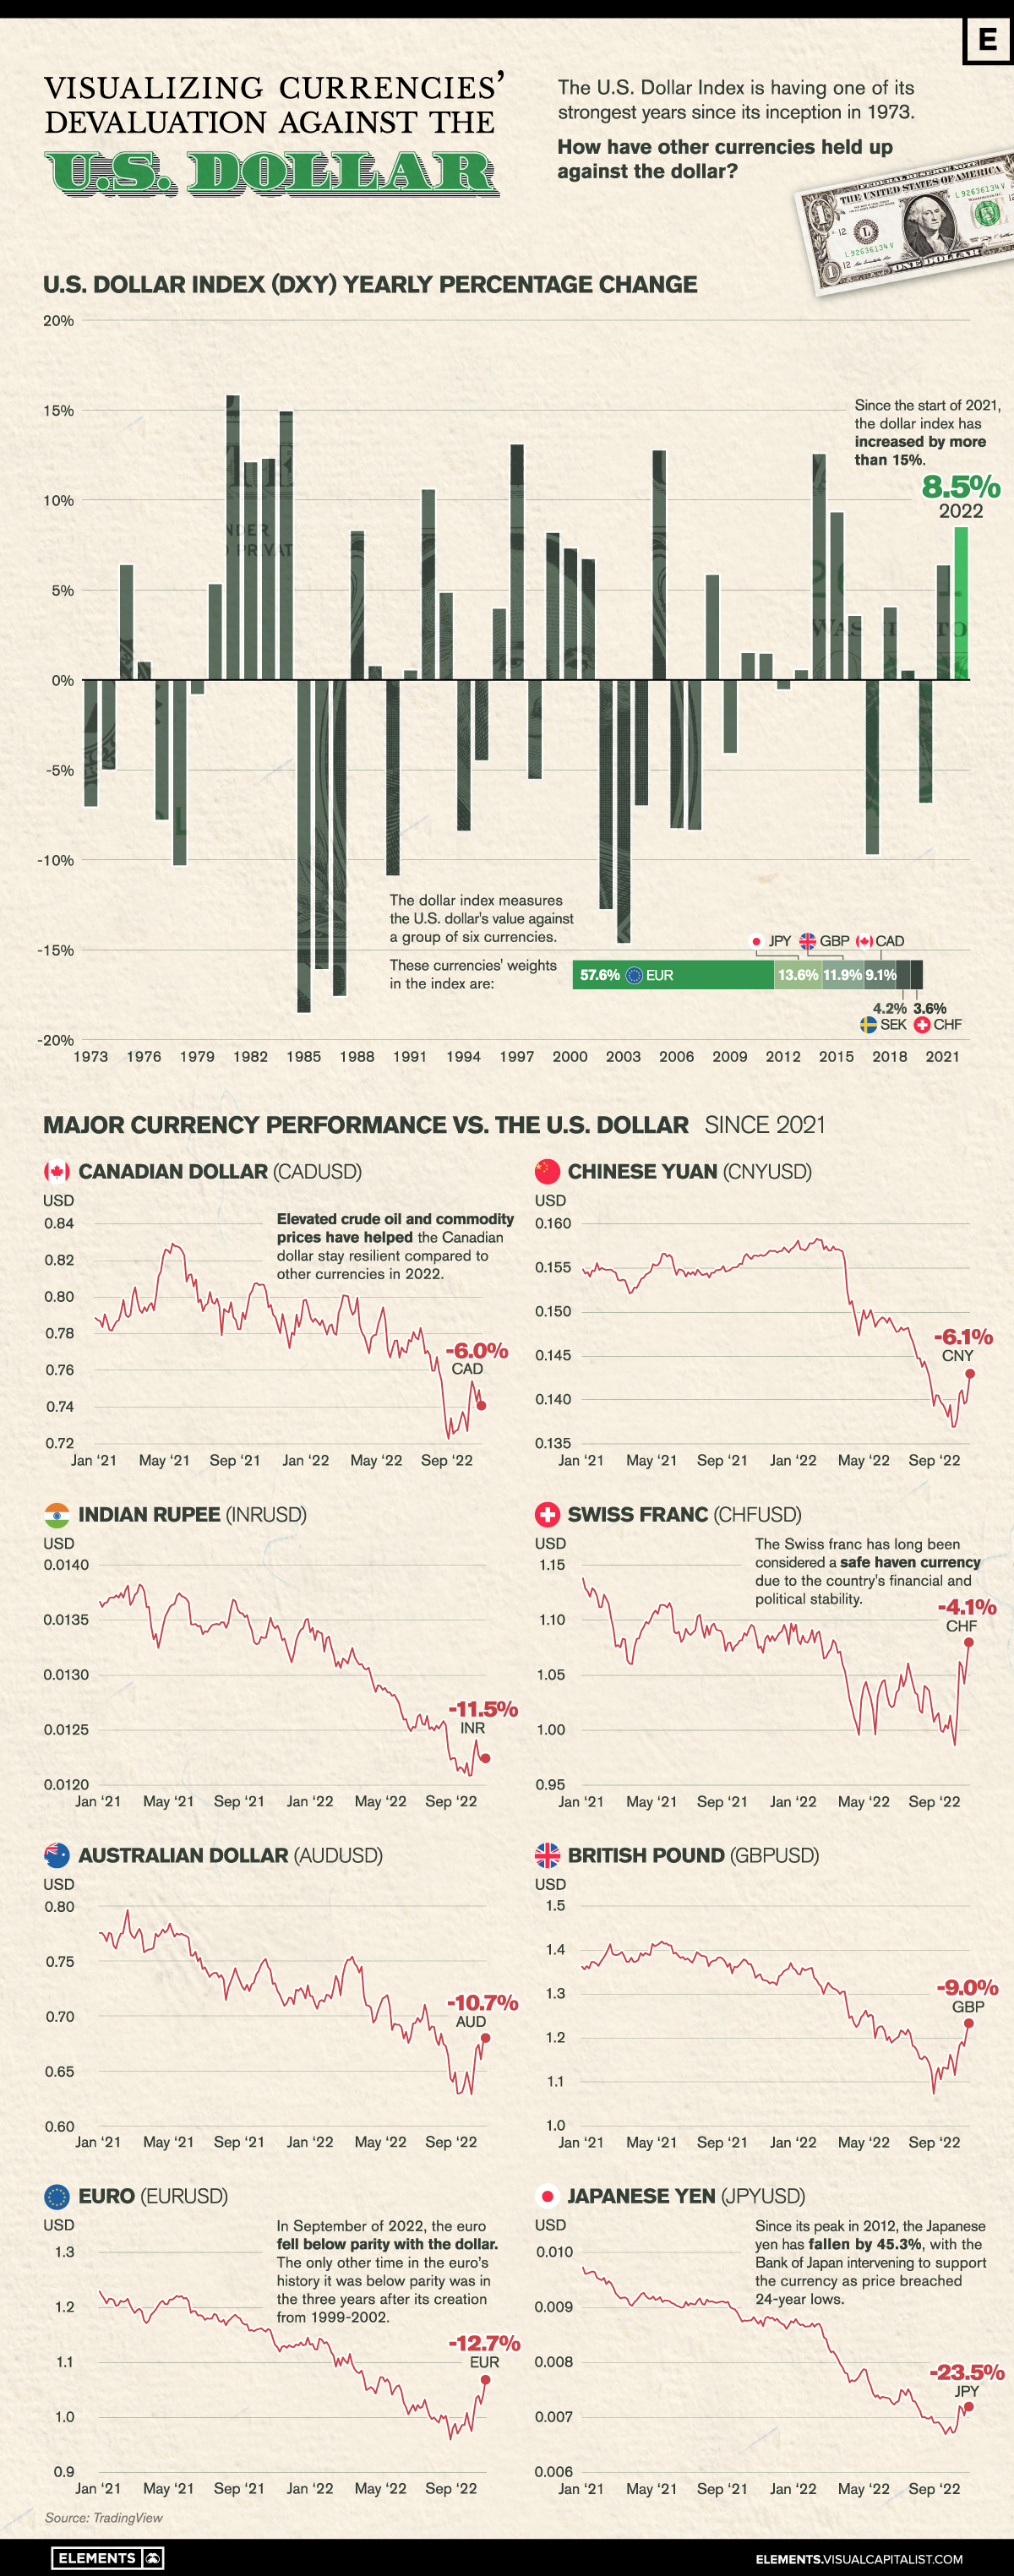
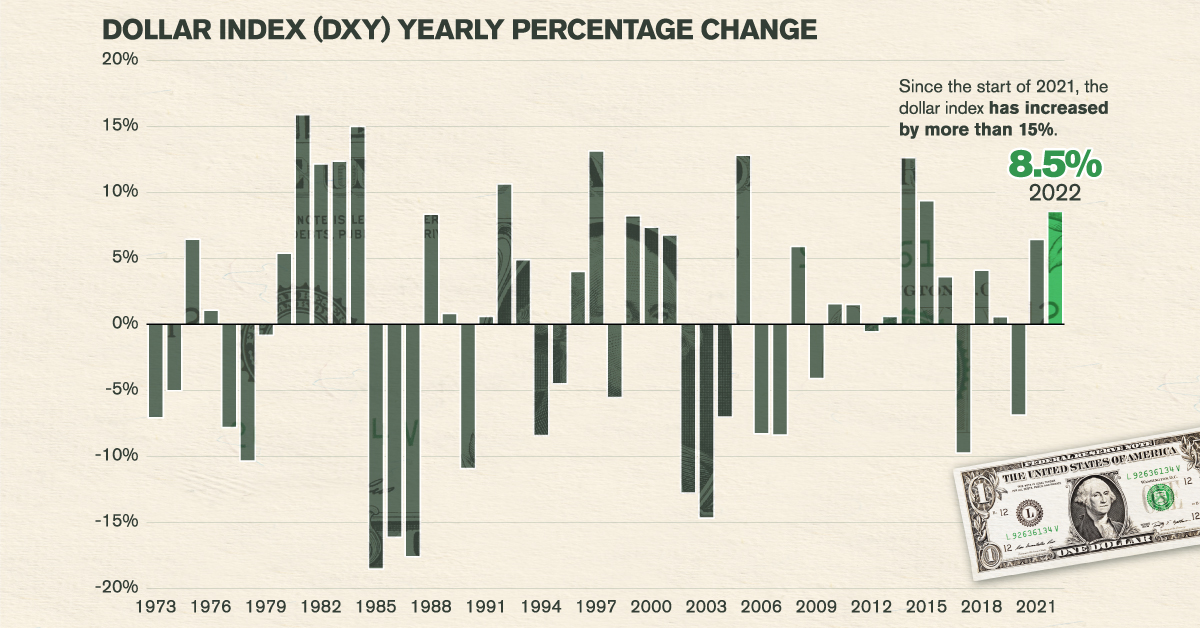
In a highly volatile and difficult year for many currencies and equities, the U.S. dollar has been a safe haven for investors.
The greenback has provided exceptional stability, with almost every currency around the world declining against the U.S. dollar in 2022.
This graphic visualizes almost 50 years of the Dollar Index’s returns along with the decline of major currencies against the U.S. dollar in the past two years using price data from TradingView.
U.S. Dollar and Major Currencies’ Returns in 2022
As shown in the graphic above, the past two years have seen nearly every major currency lose value against the U.S. dollar.
One of the currencies hit hardest is the euro, which briefly fell below parity (meaning the euro was worth less than one U.S. dollar) in September and October of 2022, before recovering with a 5.3% rally in November.
| Currency | 2021 Returns | 2022 YTD Returns |
|---|---|---|
| Japanese Yen (JPYUSD) 🇯🇵 | -10.4% | -14.7% |
| Indian Rupee (INRUSD) 🇮🇳 | 2.0% | -9.6% |
| Pound Sterling (GBPUSD) 🇬🇧 | -1.1% | -8.0% |
| Chinese Yuan (CNYUSD) 🇨🇳 | 2.7% | -8.6% |
| Euro (EURUSD) 🇪🇺 | -7.0% | -6.0% |
| Canadian Dollar (CADUSD) 🇨🇦 | 0.7% | -6.6% |
| Australian Dollar (AUDUSD) 🇦🇺 | -5.7% | -5.2% |
| Swiss Franc (CHFUSD) 🇨🇭 | -3.0% | -1.1% |
2022 YTD Returns as of December 14th 2022. (Source: TradingView)
However, the Japanese yen was the major currency hit hardest, having fallen more than 25% since the start of 2021. At the yen’s lowest point this year in October, the currency breached 24-year lows, resulting in the Bank of Japan intervening with $42.8 billion to support the country’s falling currency.
The Swiss franc and Canadian dollar have been the most resilient major currencies against the U.S. dollar since 2021, largely due to the financial and political stability of those nations. Along with this, Canada has benefitted from surging crude oil prices in 2022, exporting the majority of its crude oil across its southern border to America.
Three Reasons for the U.S. Dollar’s Strength in 2022
A variety of factors have contributed to the U.S. dollar’s strength in 2022. The rapid raising of interest rates by the Federal Reserve and tightening of their balance sheet has resulted in U.S. dollars becoming a more scarce and valuable yield-bearing asset.
As interest rates have risen, so have yields for savings accounts and fixed-income securities like U.S. treasuries, making them a more attractive alternative for investors.
At the same time, falling equity prices (especially in the technology sector) only further incentivized investors to pull out of riskier equity markets into the safety of the dollar.
Lastly, compared to many other global economies, the U.S. economy has remained resilient with the fewest risks on its horizon. Europe continues to face an ongoing energy crunch with the Russia-Ukraine conflict nearby, while China’s zero-COVID policies have hampered the country’s manufacturing sector, as well as other industries.
How Will Currencies Fare in 2023?
While the U.S. dollar has surged for much of 2022, its rally has started losing steam in the final months of the year.
In September of 2022 the Dollar Index was up 20% on the year reaching a high of 114.8, but has since retreated and given back more than half its gains for this year so far.
Investors around the world will be watching closely to see if the U.S. dollar’s rise will continue, or if this end-of-year reversal will carry through and provide major currencies some relief going into 2023.


Economy
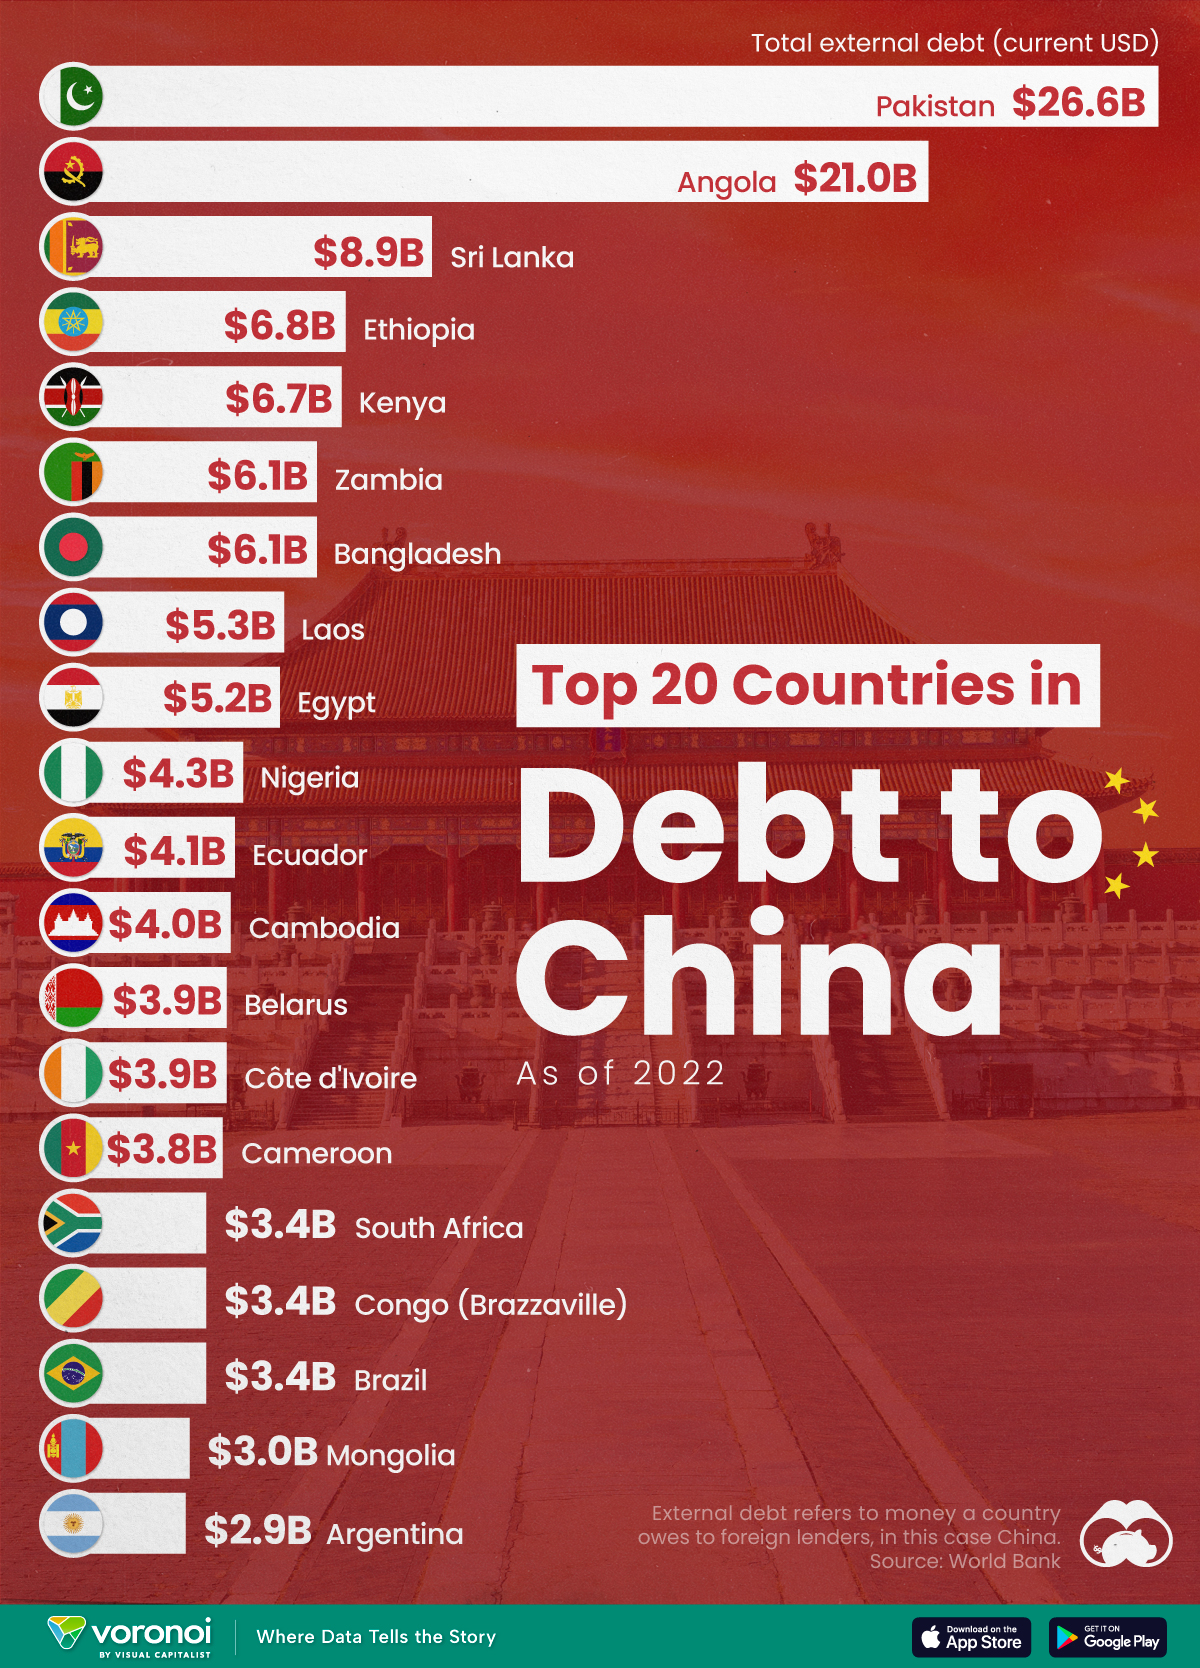
Ranked: The Top 20 Countries in Debt to China
The 20 nations featured in this graphic each owe billions in debt to China, posing concerns for their economic future.
Ranked: The Top 20 Countries in Debt to China
This was originally posted on our Voronoi app. Download the app for free on iOS or Android and discover incredible data-driven charts from a variety of trusted sources.
In this graphic, we ranked the top 20 countries by their amount of debt to China. These figures are as of 2022, and come from the World Bank (accessed via Yahoo Finance).
The data used to make this graphic can be found in the table below.
| Country | Total external debt to China ($B) |
|---|---|
| 🇵🇰 Pakistan | $26.6 |
| 🇦🇴 Angola | $21.0 |
| 🇱🇰 Sri Lanka | $8.9 |
| 🇪🇹 Ethiopia | $6.8 |
| 🇰🇪 Kenya | $6.7 |
| 🇧🇩 Bangladesh | $6.1 |
| 🇿🇲 Zambia | $6.1 |
| 🇱🇦 Laos | $5.3 |
| 🇪🇬 Egypt | $5.2 |
| 🇳🇬 Nigeria | $4.3 |
| 🇪🇨 Ecuador | $4.1 |
| 🇰🇭 Cambodia | $4.0 |
| 🇨🇮 Côte d'Ivoire | $3.9 |
| 🇧🇾 Belarus | $3.9 |
| 🇨🇲 Cameroon | $3.8 |
| 🇧🇷 Brazil | $3.4 |
| 🇨🇬 Republic of the Congo | $3.4 |
| 🇿🇦 South Africa | $3.4 |
| 🇲🇳 Mongolia | $3.0 |
| 🇦🇷 Argentina | $2.9 |
This dataset highlights Pakistan and Angola as having the largest debts to China by a wide margin. Both countries have taken billions in loans from China for various infrastructure and energy projects.
Critically, both countries have also struggled to manage their debt burdens. In February 2024, China extended the maturity of a $2 billion loan to Pakistan.
Soon after in March 2024, Angola negotiated a lower monthly debt payment with its biggest Chinese creditor, China Development Bank (CDB).
Could China be in Trouble?
China has provided developing countries with over $1 trillion in committed funding through its Belt and Road Initiative (BRI), a massive economic development project aimed at enhancing trade between China and countries across Asia, Africa, and Europe.
Many believe that this lending spree could be an issue in the near future.
According to a 2023 report by AidData, 80% of these loans involve countries in financial distress, raising concerns about whether participating nations will ever be able to repay their debts.
While China claims the BRI is a driver of global development, critics in the West have long warned that the BRI employs debt-trap diplomacy, a tactic where one country uses loans to gain influence over another.
Editor’s note: The debt shown in this visualization focuses only on direct external debt, and does not include publicly-traded, liquid, debt securities like bonds. Furthermore, it’s worth noting the World Bank data excludes some countries with data accuracy or reporting issues, such as Venezuela.
Learn More About Debt from Visual Capitalist
If you enjoyed this post, check out our breakdown of $97 trillion in global government debt.

-

 Economy7 days ago
Ranked: The Top 20 Countries in Debt to China
-

 Demographics2 weeks ago
The Countries That Have Become Sadder Since 2010
-

 Money2 weeks ago
Charted: Who Has Savings in This Economy?
-

 Technology2 weeks ago
Visualizing AI Patents by Country
-

 Economy2 weeks ago
Economic Growth Forecasts for G7 and BRICS Countries in 2024
-

 Wealth2 weeks ago
Charted: Which City Has the Most Billionaires in 2024?
-

 Technology1 week ago
All of the Grants Given by the U.S. CHIPS Act
-

 Green1 week ago
The Carbon Footprint of Major Travel Methods