Misc
A Timeline of Media-Inflamed Fears (2000-2017)
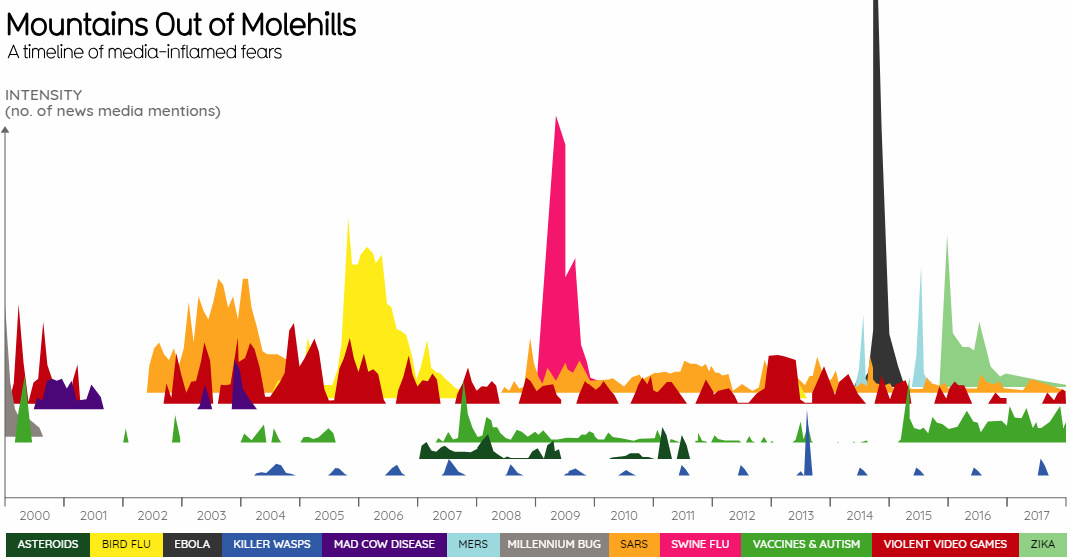
A Timeline of Media-Inflamed Fears (2000-2017)
Modern media does not always have the best reputation for providing complex and nuanced commentary.
The news cycle is sensational enough when we’re dealing with the regular issues of the day. But add in some uncertainty and urgency – such as when the world is dealing with an outbreak like SARS, Mad Cow Disease, Ebola, or even Y2K – and each headline seems to get more provocative or speculative than the last.
Today’s graphics come to us from Information is Beautiful, and they show the intensity of news mentions for different topics that stoked frenzies in the media from 2000-2017.
Visualizing Ebola Sensationalism
We all make mistakes, but headlines for Ebola brought a new level of hyperbole to the table.
“Ebola in the air? A nightmare that could happen” – CNN (link)
“New Ebola Cases May Soon Reach 10,000 a Week, Officials Predict” – NYT (link)
“Ebola as ISIS Bio-Weapon?” – Forbes (link)
In fact, the outbreak in 2014 goes down as the most sensationalized events in the last 17 years.
Here’s all other topics scaled to match Ebola mentions (which go “off the page” in the first graph):
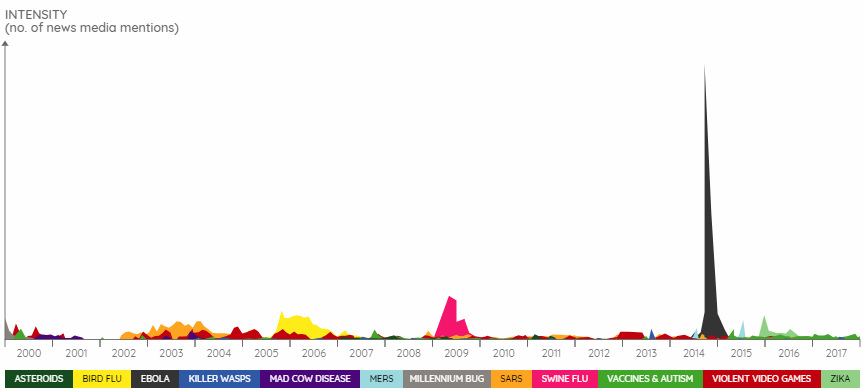
Nothing is even close.
By the way, it turned out that Ebola didn’t mutate into a scary airborne virus. The CNN article with the crazy headline even admits in the body of the article itself: “Speculation that Ebola virus disease might mutate into a form that could easily spread among humans through the air is just that: speculation, unsubstantiated by any evidence.”
Meanwhile, Ebola cases hit a maximum rate of 6,987 in a month, mainly because of delayed reporting of older cases in Liberia. Regardless, that is just 17% of the predicted “10,000 cases per week” rate reported in a New York Times headline.
Finally, as you’re probably aware: ISIS did not weaponize Ebola, either. Made for good clickbait, though.
Scaled to Death
When we scale the data to match total deaths, the sensationalism of many of the outbreaks is even clearer:
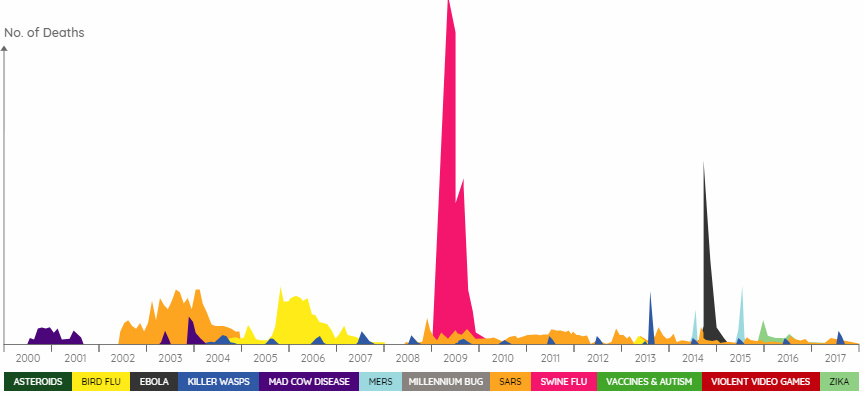
The death count for Ebola did eventually hit 11,310 globally, and Swine Flu resulted in 18,500 lab-confirmed deaths (and potentially many more). However, most of these outbreaks were relatively harmless in relative terms. The Zika Virus, for example, resulted in only a handful of deaths.
While having zero deaths is certainly the ideal, and many of the issues above should be taken very seriously especially as stories develop, we should be careful not to blow things out of proportion. Making mountains out of molehills does not help anyone, and it adds to growing distrust of media in general.


VC+
VC+: Get Our Key Takeaways From the IMF’s World Economic Outlook
A sneak preview of the exclusive VC+ Special Dispatch—your shortcut to understanding IMF’s World Economic Outlook report.

Have you read IMF’s latest World Economic Outlook yet? At a daunting 202 pages, we don’t blame you if it’s still on your to-do list.
But don’t worry, you don’t need to read the whole April release, because we’ve already done the hard work for you.
To save you time and effort, the Visual Capitalist team has compiled a visual analysis of everything you need to know from the report—and our VC+ Special Dispatch is available exclusively to VC+ members. All you need to do is log into the VC+ Archive.
If you’re not already subscribed to VC+, make sure you sign up now to access the full analysis of the IMF report, and more (we release similar deep dives every week).
For now, here’s what VC+ members get to see.
Your Shortcut to Understanding IMF’s World Economic Outlook
With long and short-term growth prospects declining for many countries around the world, this Special Dispatch offers a visual analysis of the key figures and takeaways from the IMF’s report including:
- The global decline in economic growth forecasts
- Real GDP growth and inflation forecasts for major nations in 2024
- When interest rate cuts will happen and interest rate forecasts
- How debt-to-GDP ratios have changed since 2000
- And much more!

Get the Full Breakdown in the Next VC+ Special Dispatch
VC+ members can access the full Special Dispatch by logging into the VC+ Archive, where you can also check out previous releases.
Make sure you join VC+ now to see exclusive charts and the full analysis of key takeaways from IMF’s World Economic Outlook.
Don’t miss out. Become a VC+ member today.
What You Get When You Become a VC+ Member
VC+ is Visual Capitalist’s premium subscription. As a member, you’ll get the following:
- Special Dispatches: Deep dive visual briefings on crucial reports and global trends
- Markets This Month: A snappy summary of the state of the markets and what to look out for
- The Trendline: Weekly curation of the best visualizations from across the globe
- Global Forecast Series: Our flagship annual report that covers everything you need to know related to the economy, markets, geopolitics, and the latest tech trends
- VC+ Archive: Hundreds of previously released VC+ briefings and reports that you’ve been missing out on, all in one dedicated hub
You can get all of the above, and more, by joining VC+ today.

-

 Debt1 week ago
How Debt-to-GDP Ratios Have Changed Since 2000
-

 Markets2 weeks ago
Ranked: The World’s Top Flight Routes, by Revenue
-

 Countries2 weeks ago
Population Projections: The World’s 6 Largest Countries in 2075
-

 Markets2 weeks ago
The Top 10 States by Real GDP Growth in 2023
-

 Demographics2 weeks ago
The Smallest Gender Wage Gaps in OECD Countries
-

 United States2 weeks ago
Where U.S. Inflation Hit the Hardest in March 2024
-

 Green2 weeks ago
Top Countries By Forest Growth Since 2001
-

 United States2 weeks ago
Ranked: The Largest U.S. Corporations by Number of Employees