Money
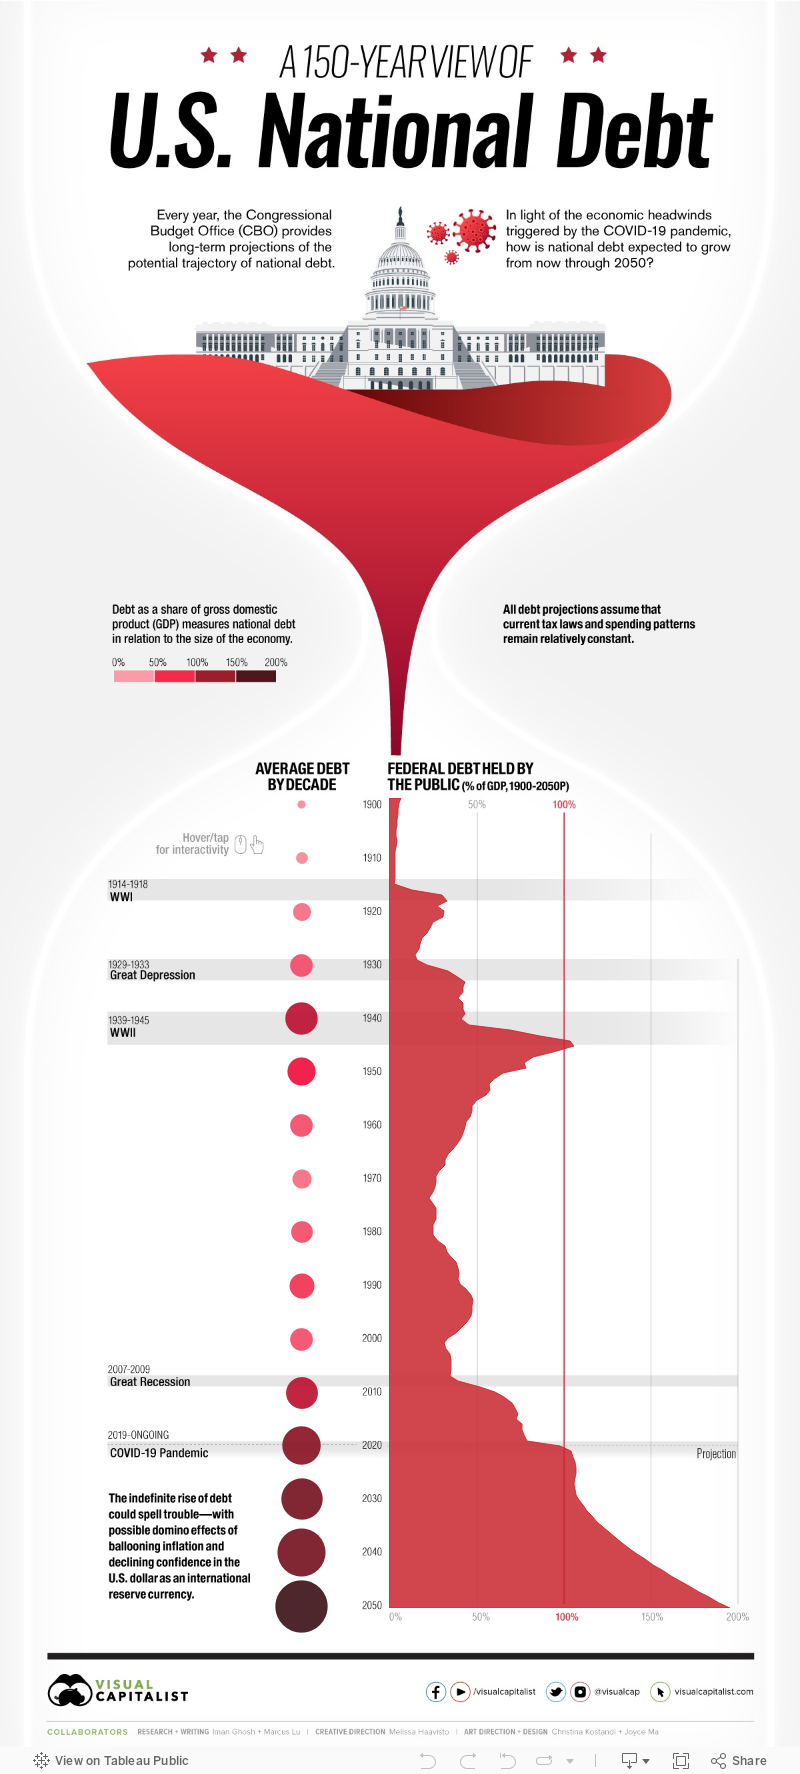
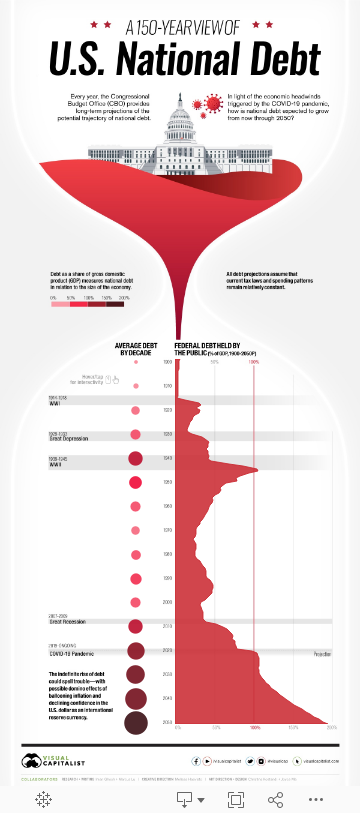
Timeline: 150 Years of U.S. National Debt
This interactive visualization uses debt held by the public for its calculations, which excludes intragovernmental holdings.

var divElement = document.getElementById(‘viz1710977392473’); var vizElement = divElement.getElementsByTagName(‘object’)[0]; vizElement.style.width=’1200px’;vizElement.style.height=’2647px’; var scriptElement = document.createElement(‘script’); scriptElement.src = ‘https://public.tableau.com/javascripts/api/viz_v1.js’; vizElement.parentNode.insertBefore(scriptElement, vizElement);


Looking Back at 150 Years of U.S. Debt
The total U.S. national debt reached an all-time high of $28 trillion* in March 2021, the largest amount ever recorded.
Recent increases to the debt have been fueled by massive fiscal stimulus bills like the CARES Act ($2.2 trillion in March 2020), the Consolidated Appropriations Act ($2.3 trillion in December 2020), and most recently, the American Rescue Plan ($1.9 trillion in March 2021).
To see how America’s debt has gotten to its current point, we’ve created an interactive timeline using data from the Congressional Budget Office (CBO). It’s crucial to note that the data set uses U.S. national debt held by the public, which excludes intergovernmental holdings.
*Editor’s note: This top level figure includes intragovernmental holdings, or the roughly $6 trillion of debt owed within the government to itself.
What Influences U.S. Debt?
It’s worth pointing out that the national debt hasn’t always been this large.
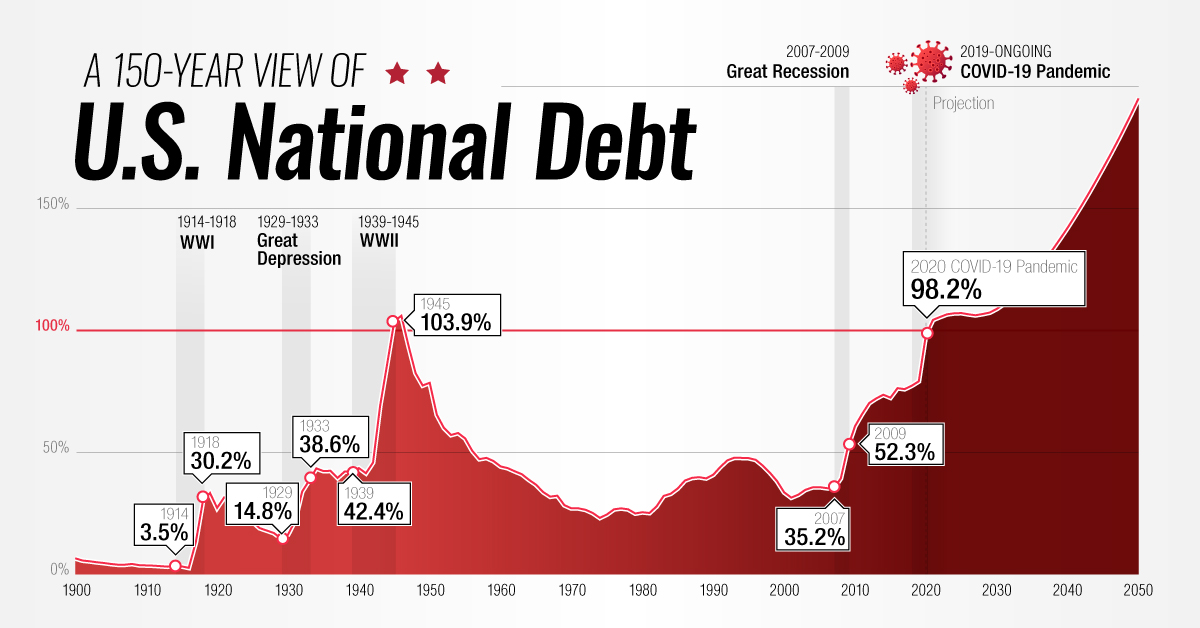
Looking back 150 years, we can see that its size relative to GDP has fluctuated greatly, hitting multiple peaks and troughs. These movements generally correspond with events such as wars and recessions.
| Decade | Gross debt at start of decade (USD billions) | Avg. Debt Held By Public Throughout Decade (% of GDP) | Major Events |
|---|---|---|---|
| 1900 | - | 4.8% | - |
| 1910 | - | 10.0% | World War I |
| 1920 | - | 22.9% | The Great Depression |
| 1930 | $16 | 36.4% | President Roosevelt's New Deal |
| 1940 | $40 | 75.1% | World War II |
| 1950 | $257 | 56.8% | Korean War |
| 1960 | $286 | 37.3% | Vietnam War |
| 1970 | $371 | 26.1% | Stagflation (inflation + high unemployment) |
| 1980 | $908 | 33.7% | President Reagan's tax cuts |
| 1990 | $3,233 | 44.7% | Gulf War |
| 2000 | $5,674 | 36.6% | 9/11 attacks & Global Financial Crisis |
| 2010 | $13,562 | 72.4% | Debt ceiling is raised by Congress |
| 2020 | $27,748 | 105.6% | COVID-19 pandemic |
| 2030P | - | 121.8% | - |
| 2040P | - | 164.7% | - |
| 2050P | - | 195.2% | - |
Source: CBO, The Balance
To gain further insight into the history of the U.S. national debt, let’s review some key economic events in America’s history.
The Great Depression
After its WWI victory, the U.S. enjoyed a period of post-war prosperity commonly referred to as the Roaring Twenties.
This led to the creation of a stock market bubble which would eventually burst in 1929, causing massive damage to the U.S. economy. The country’s GDP was cut in half (partially due to deflation), while the unemployment rate rose to 25%.
Government revenues dipped as a result, pushing debt held by the public as a % of GDP from its low of 15% in 1929, to a high of 44% in 1934.
World War II
WWII quickly brought the U.S. back to full employment, but it was an incredibly expensive endeavor. The total cost of the war is estimated to be over $4 trillion in today’s dollars.
To finance its efforts, the U.S. relied heavily on war bonds, a type of bond that is marketed to citizens during armed conflicts. These bonds were sold in various denominations ranging from $25-$10,000 and had a 2.9% interest rate compounded semiannually.
Over 85 million Americans purchased these bonds, helping the U.S. government to raise $186 billion (not adjusted for inflation). This pushed debt above 100% of GDP for the first time ever, but was also enough to cover 63% of the war’s total cost.
The Postwar Period
Following World War II, the U.S. experienced robust economic growth.
Despite involvement in the Korea and Vietnam wars, debt-to-GDP declined to a low of 23% in 1974—largely because these wars were financed by raising taxes rather than borrowing.
The economy eventually slowed in the early 1980s, prompting President Reagan to slash taxes on corporations and high earning individuals. Income taxes on the top bracket, for example, fell from 70% to 50%.
2008 Global Financial Crisis
The Global Financial Crisis served as a precursor for today’s debt landscape.
Interest rates were reduced to near-zero levels to speed up the economic recovery, enabling the government to borrow with relative ease. Rates remained at these suppressed levels from 2008 to 2015, and debt-to-GDP grew from 39% to 73%.
It’s important to note that even before 2008, the U.S. government had been consistently running annual budget deficits. This means that the government spends more than it earns each year through taxes.
The National Debt Today
The COVID-19 pandemic damaged many areas of the global economy, forcing governments to drastically increase their spending. At the same time, many central banks once again reduced interest rates to zero.
This has resulted in a growing snowball of government debt that shows little signs of shrinking, even though the worst of the pandemic is already behind us.
In the U.S., federal debt has reached or surpassed WWII levels. When excluding intragovernmental holdings, it now sits at 104% of GDP—and including those holdings, it sits at 128% of GDP. But while the debt is expected to grow even further, the cost of servicing this debt has actually decreased in recent years.
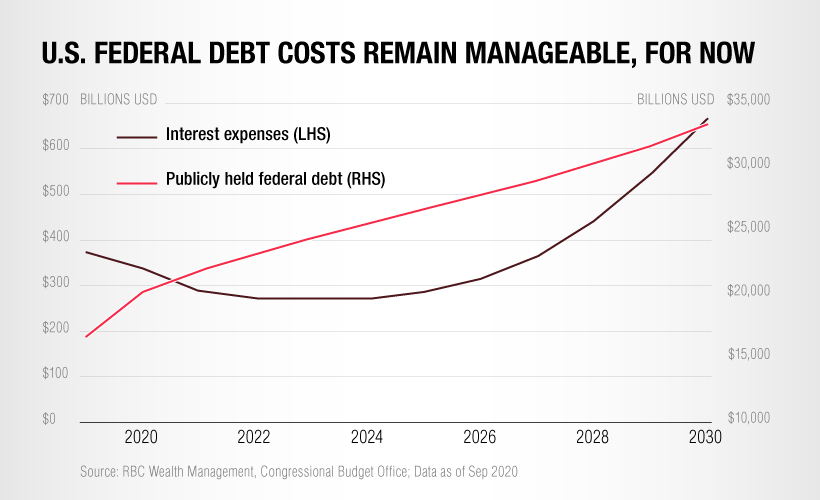
This is because existing government bonds, which were originally issued at higher rates, are now maturing and being refinanced to take advantage of today’s lower borrowing costs.
The key takeaway from this is that the U.S. national debt will remain manageable for the foreseeable future. Longer term, however, interest expenses are expected to grow significantly—especially if interest rates begin to rise again.


Economy
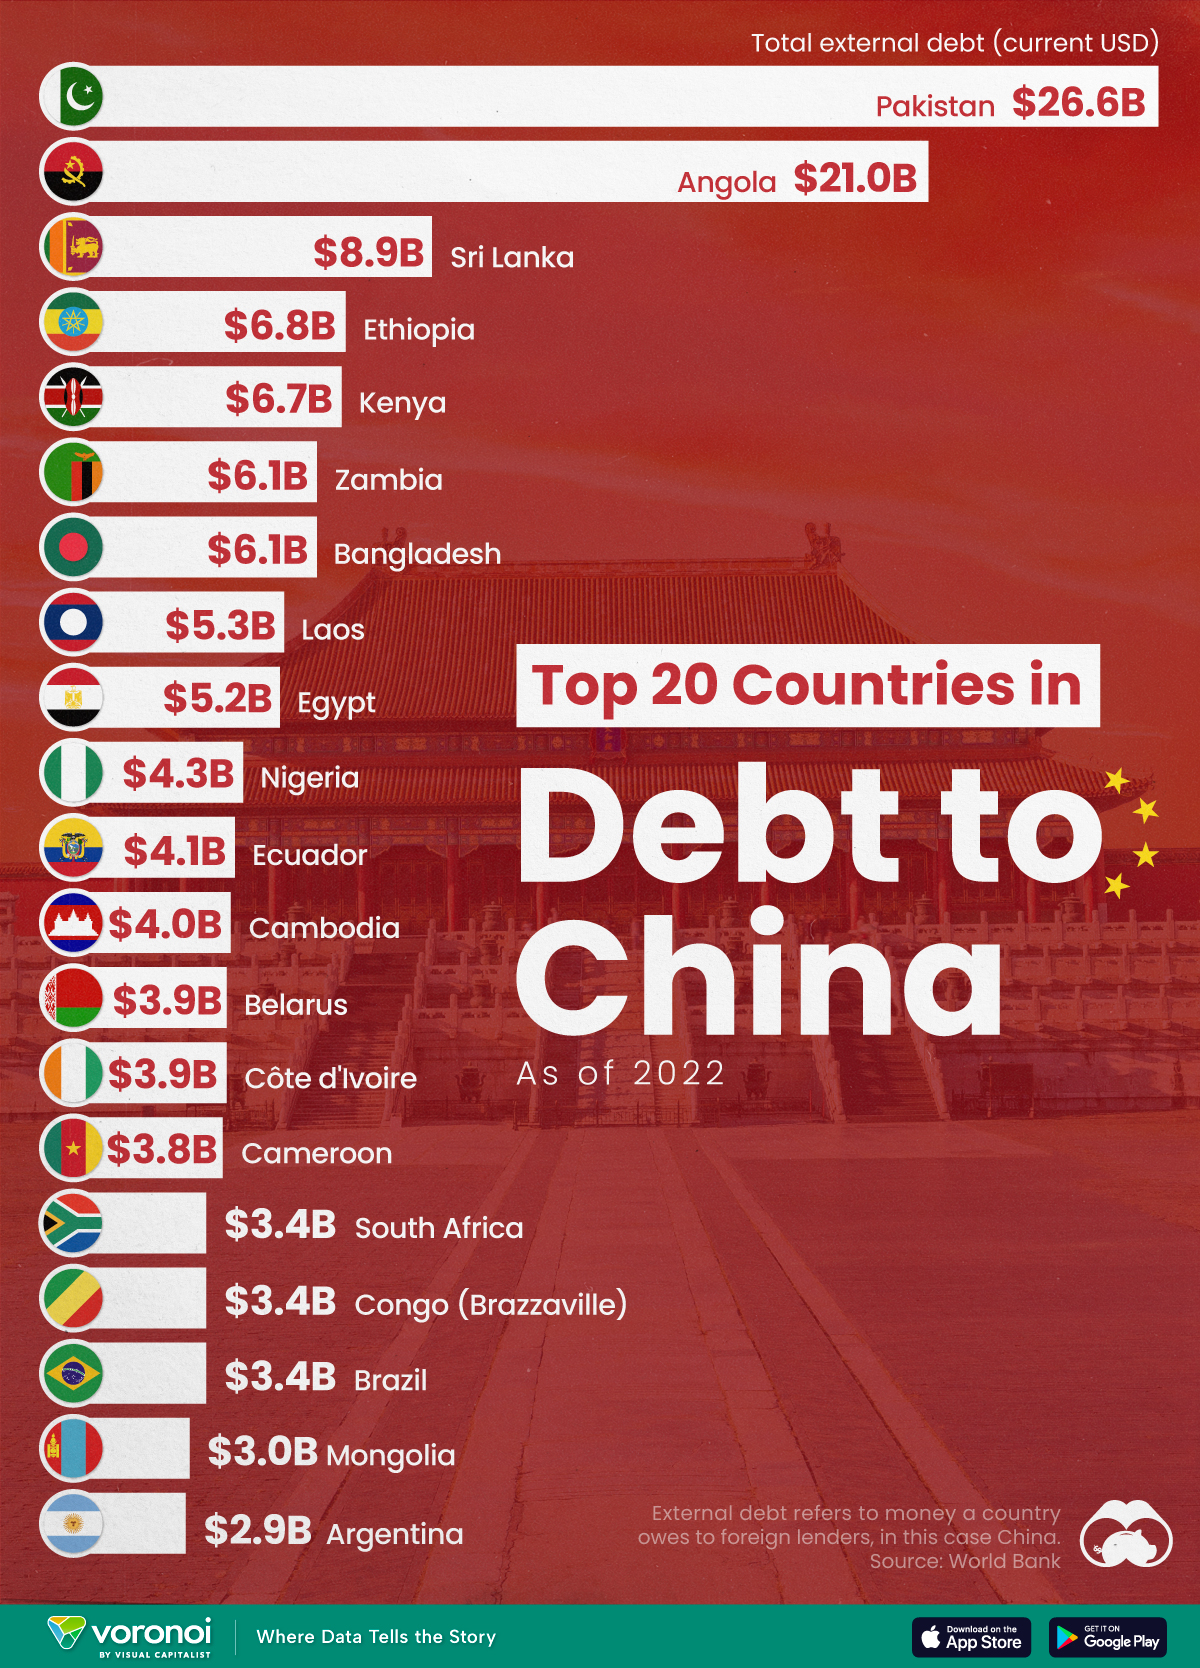
Ranked: The Top 20 Countries in Debt to China
The 20 nations featured in this graphic each owe billions in debt to China, posing concerns for their economic future.
Ranked: The Top 20 Countries in Debt to China
This was originally posted on our Voronoi app. Download the app for free on iOS or Android and discover incredible data-driven charts from a variety of trusted sources.
In this graphic, we ranked the top 20 countries by their amount of debt to China. These figures are as of 2022, and come from the World Bank (accessed via Yahoo Finance).
The data used to make this graphic can be found in the table below.
| Country | Total external debt to China ($B) |
|---|---|
| 🇵🇰 Pakistan | $26.6 |
| 🇦🇴 Angola | $21.0 |
| 🇱🇰 Sri Lanka | $8.9 |
| 🇪🇹 Ethiopia | $6.8 |
| 🇰🇪 Kenya | $6.7 |
| 🇧🇩 Bangladesh | $6.1 |
| 🇿🇲 Zambia | $6.1 |
| 🇱🇦 Laos | $5.3 |
| 🇪🇬 Egypt | $5.2 |
| 🇳🇬 Nigeria | $4.3 |
| 🇪🇨 Ecuador | $4.1 |
| 🇰🇭 Cambodia | $4.0 |
| 🇨🇮 Côte d'Ivoire | $3.9 |
| 🇧🇾 Belarus | $3.9 |
| 🇨🇲 Cameroon | $3.8 |
| 🇧🇷 Brazil | $3.4 |
| 🇨🇬 Republic of the Congo | $3.4 |
| 🇿🇦 South Africa | $3.4 |
| 🇲🇳 Mongolia | $3.0 |
| 🇦🇷 Argentina | $2.9 |
This dataset highlights Pakistan and Angola as having the largest debts to China by a wide margin. Both countries have taken billions in loans from China for various infrastructure and energy projects.
Critically, both countries have also struggled to manage their debt burdens. In February 2024, China extended the maturity of a $2 billion loan to Pakistan.
Soon after in March 2024, Angola negotiated a lower monthly debt payment with its biggest Chinese creditor, China Development Bank (CDB).
Could China be in Trouble?
China has provided developing countries with over $1 trillion in committed funding through its Belt and Road Initiative (BRI), a massive economic development project aimed at enhancing trade between China and countries across Asia, Africa, and Europe.
Many believe that this lending spree could be an issue in the near future.
According to a 2023 report by AidData, 80% of these loans involve countries in financial distress, raising concerns about whether participating nations will ever be able to repay their debts.
While China claims the BRI is a driver of global development, critics in the West have long warned that the BRI employs debt-trap diplomacy, a tactic where one country uses loans to gain influence over another.
Editor’s note: The debt shown in this visualization focuses only on direct external debt, and does not include publicly-traded, liquid, debt securities like bonds. Furthermore, it’s worth noting the World Bank data excludes some countries with data accuracy or reporting issues, such as Venezuela.
Learn More About Debt from Visual Capitalist
If you enjoyed this post, check out our breakdown of $97 trillion in global government debt.

-

 Money7 days ago
Charted: Who Has Savings in This Economy?
-

 Green2 weeks ago
Ranked: The Countries With the Most Air Pollution in 2023
-

 Green2 weeks ago
Ranking the Top 15 Countries by Carbon Tax Revenue
-

 Markets2 weeks ago
U.S. Debt Interest Payments Reach $1 Trillion
-

 Mining2 weeks ago
Gold vs. S&P 500: Which Has Grown More Over Five Years?
-

 Energy2 weeks ago
The World’s Biggest Nuclear Energy Producers
-

 Misc2 weeks ago
How Hard Is It to Get Into an Ivy League School?
-

 Debt2 weeks ago
How Debt-to-GDP Ratios Have Changed Since 2000