Markets
The Pandemic Economy: Which Stocks are Weathering the Storm?
The Pandemic Economy: The Stocks Weathering the Storm
When markets get wacky, even the best companies can’t avoid the maelstrom.
Investors were already tiptoeing on broken glass, knowing that the longest U.S. stock market bull run in history was getting long in the tooth.
Then, when the market foresaw the potential damage that could be caused by the COVID-19 pandemic, it quickly created a vortex that would suck almost everything into it.
Bizarro Market
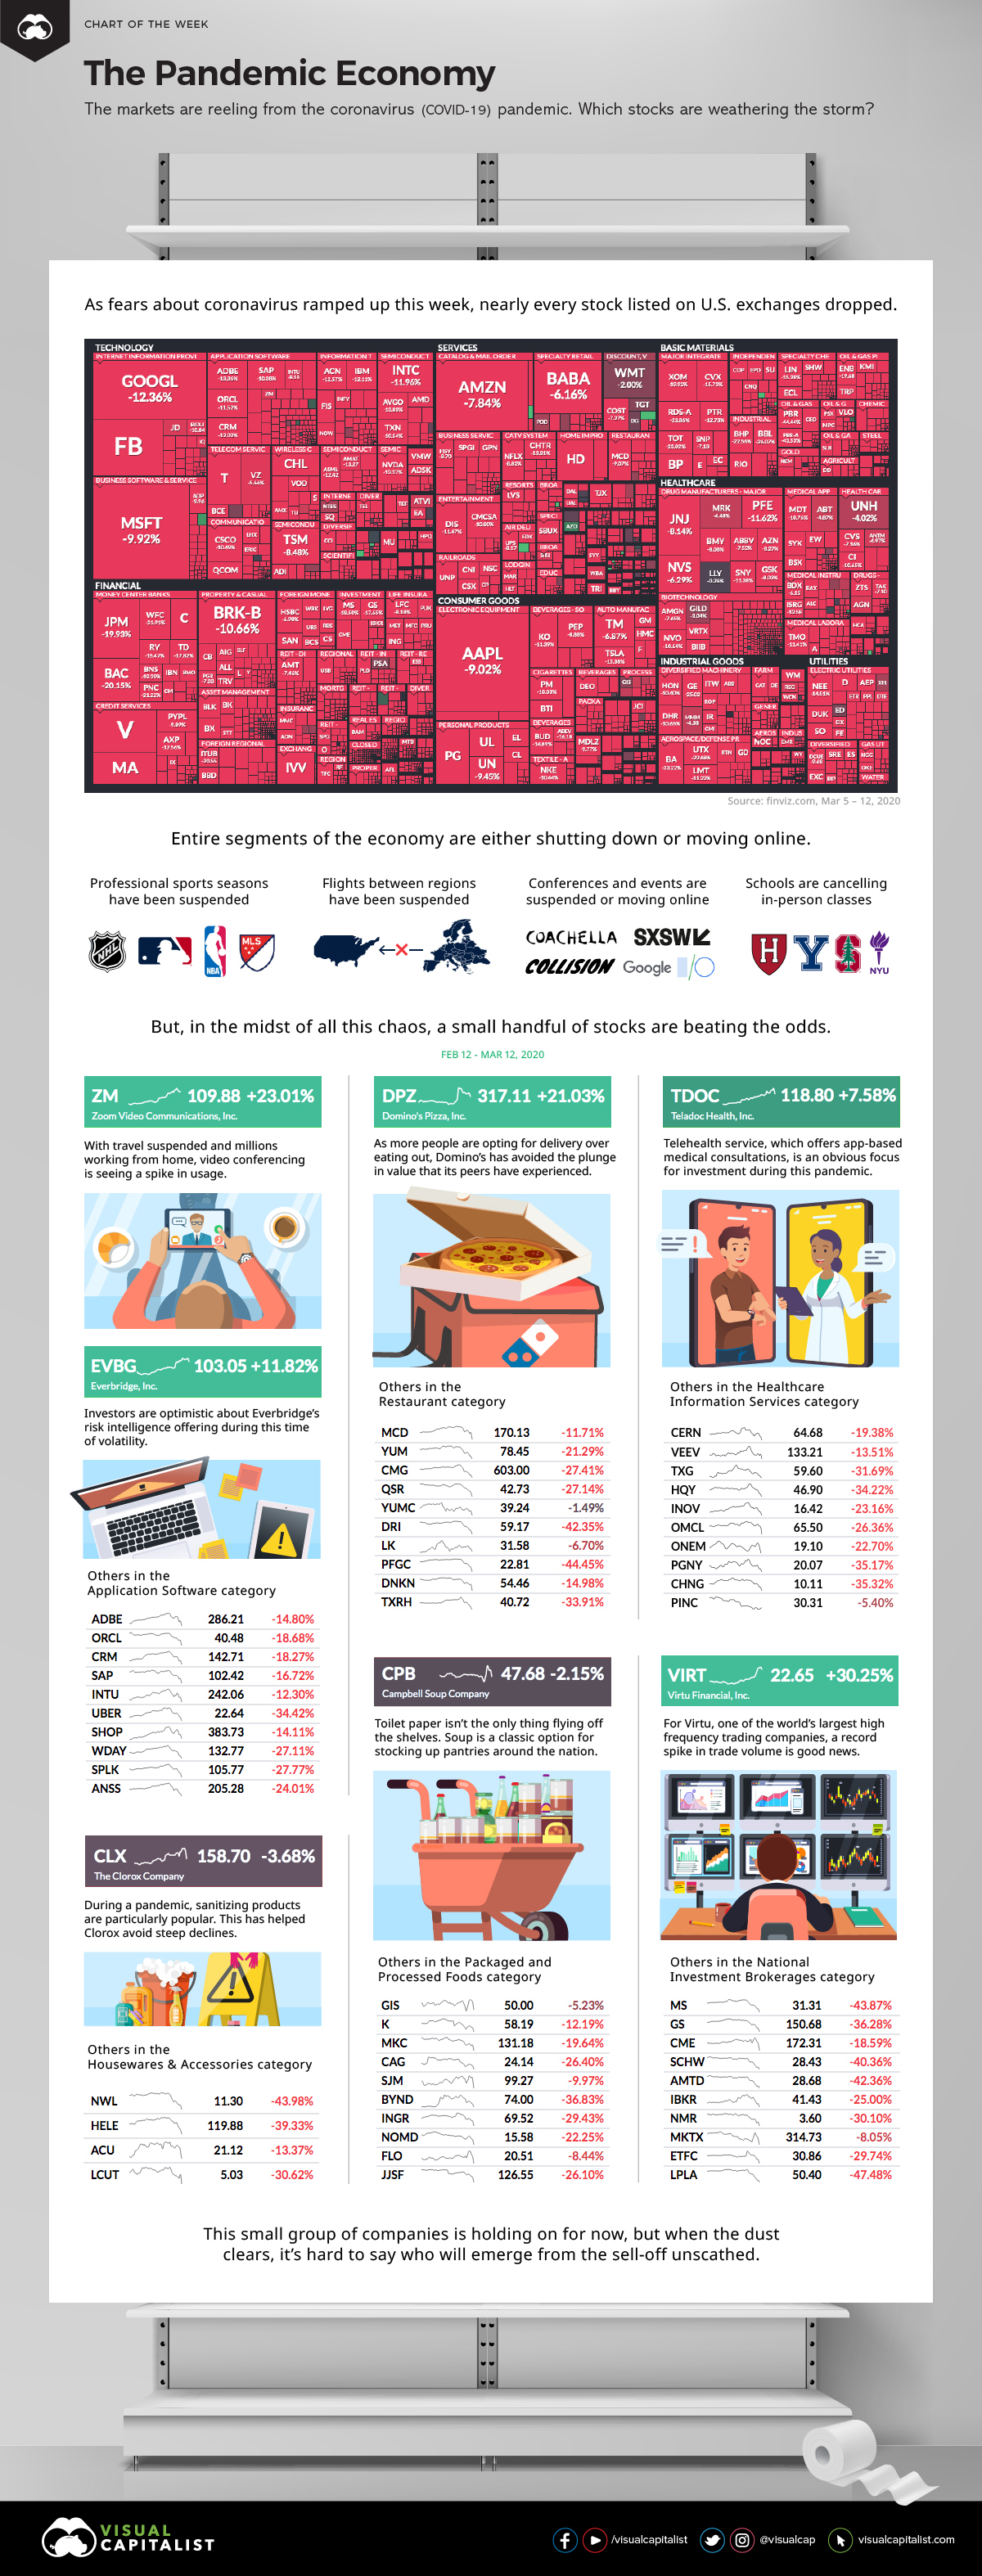
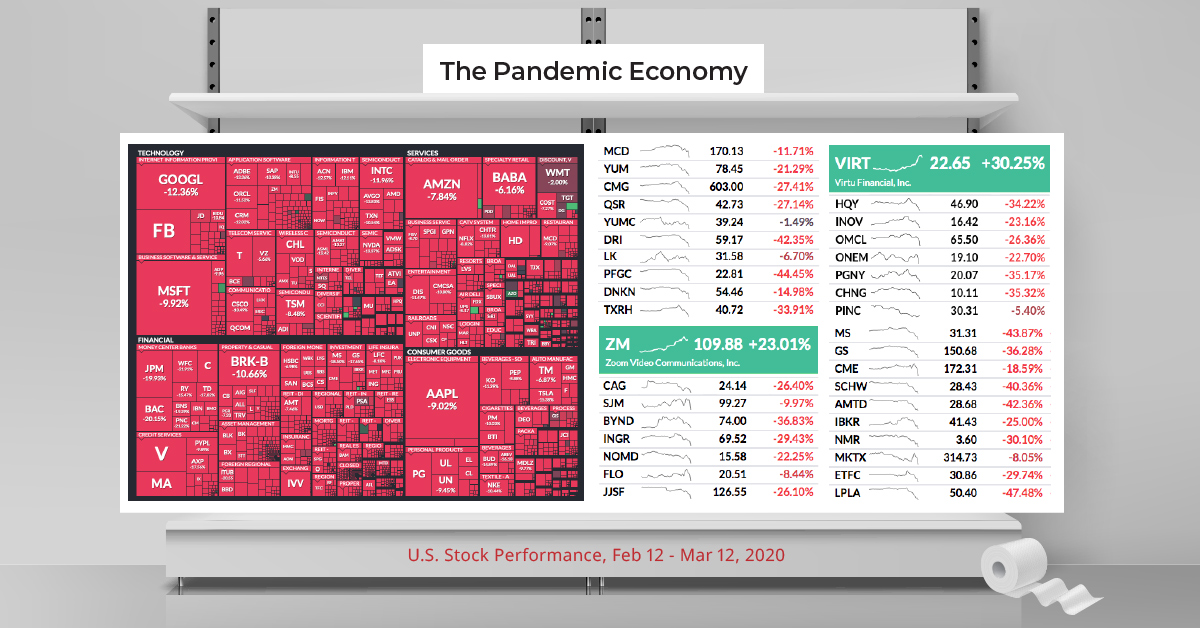
In the last week, markets flipped into an alternate universe. Every major stock got crushed, while suddenly those holding onto stockpiles of toilet paper and soup reigned supreme.
In such unique circumstances, we wondered which companies were weathering the storm of volatility. To do this, we used Finviz to pull up a visualization of S&P 500 performance, then investigating the segments of the market that were doing well in spite of the recent plunge.
| Stock selection | Performance (Mar 5-12) | Components |
|---|---|---|
| S&P 500 | -18.0% 📉 | The 500 largest U.S. companies by market cap |
| The Pandemic Economy | +12.7% 📈 | Soup, bleach, pizza, and telecommuting stocks |
A few companies not only avoided the chaos — they actually thrived over the last week.
Let’s look at why!
Not Getting Bugged Down
With global travel, events, and social gatherings screeching to a halt, it’s obvious that this is not a winning situation for any typical economy.
However, it’s hard for everyone to simultaneously be a loser, and it’s always inevitable that some stocks will benefit from any crisis — or at least not get hit as hard as their peers.
- Zoom Video Communications (ZM)
There’s no doubt a pandemic is tough on brick-and-mortar companies, but for most white collar workers the show must go on. As a pure play stock in the video conferencing category, Zoom is uniquely positioned as companies shift to more remote work. - Domino’s Pizza (DPZ)
With people wanting to avoid crowds because of COVID-19, it’s natural to want to order in. Domino’s, as well as other companies that focus on food delivery, stand to benefit in the short term from the virus. - Campbell Soup Company (CPB)
Campbell is the quintessential counter-cyclical stock, and even more so in a prepping environment. When the global outlook is gloomy, people want to stockpile — and soup is a major pantry staple. - Teladoc Health, Inc. (TDOC)
If sitting in a doctor’s office with dozens of other sick people can be avoided, it seems it would be regarded as a prudent decision. For this reason, remote health services are an obvious focus for investors during the pandemic. - The Clorox Company (CLX)
Wash your hands. Wash your hands. Have you heard that you should wash your hands to avoid the spread of the coronavirus? Clorox benefits from this sudden interest in sanitation and cleanliness. - Everbridge, Inc. (EVBG)
When times are uncertain, global decision-makers want to get as much quality information as possible. Everbridge offers a risk intelligence platform that provides this service. - Virtu Financial, Inc. (VIRT)
Whether markets are going up or down, large amounts of volume and volatility are a good thing for financial services companies that make money from high frequency trading.
Not all of these companies are in the green — some have simply traded sideways — but on average, they’ve seen a 12.7% bump in price over the last week.
Whether that will last in a fast-changing news environment is another story.


Economy
The Most Valuable Companies in Major EU Economies
From semiconductor equipment manufacturers to supercar makers, the EU’s most valuable companies run the gamut of industries.
Most Valuable Companies in the EU, by Country
This was originally posted on our Voronoi app. Download the app for free on iOS or Android and discover incredible data-driven charts from a variety of trusted sources.
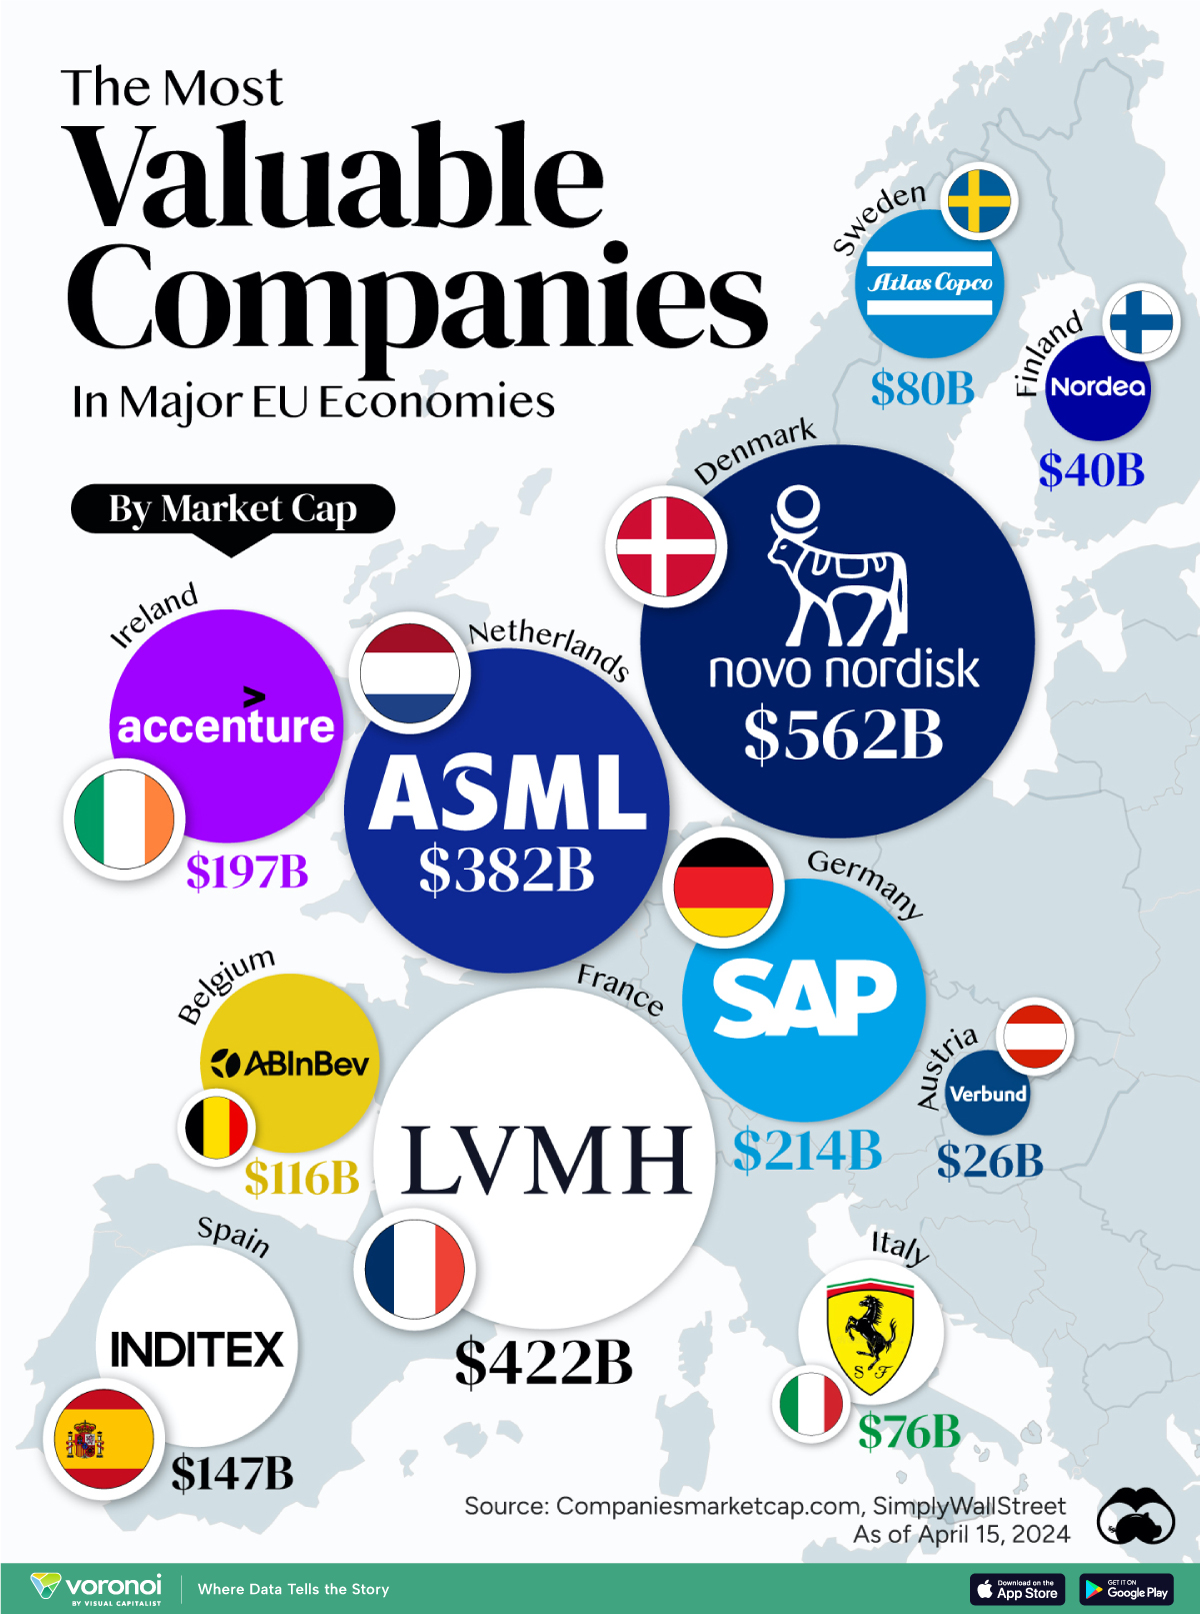
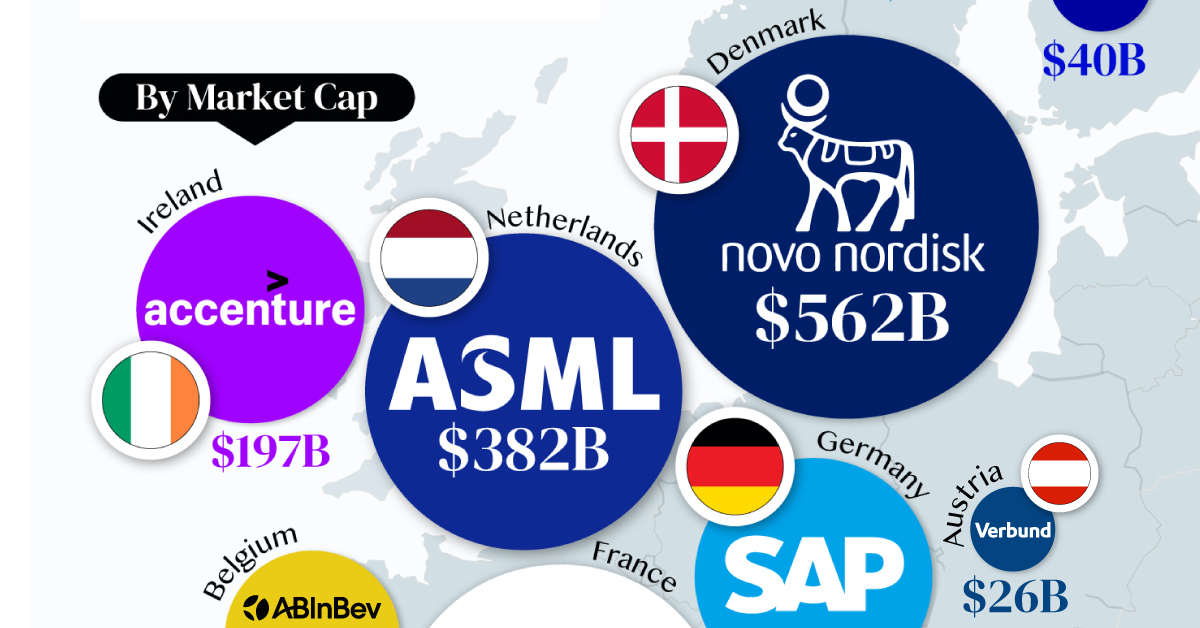
In this graphic, we mapped out the most valuable corporations in 11 major EU economies, based on their market capitalizations as of April 15th, 2024. All figures are in USD, and were sourced from Companiesmarketcap.com.
Novo Nordisk is currently worth more than $550 billion, making it Europe’s most valuable company by a wide margin. The pharmaceutical giant specializes in diabetes and weight-loss drugs. Demand for two of them, Ozempic and Wegovy, has surged due to their weight-loss capabilities, even causing nationwide shortages in the United States.
The following table includes an expanded list of the most valuable publicly-traded company in larger EU economies. Many of these were not included in the graphic due to space limitations.
| Country | Company | Sector | Market Cap |
|---|---|---|---|
| 🇩🇰 Denmark | 💊 Novo Nordisk | Pharmaceuticals | $562B |
| 🇫🇷 France | 👜 LVMH | Luxury Goods | $422B |
| 🇳🇱 Netherlands | 🔧 ASML | Semiconductor Equipment | $382B |
| 🇩🇪 Germany | 💼 SAP | Enterprise Software | $214B |
| 🇮🇪 Ireland | 🖥️ Accenture | IT Services | $197B |
| 🇪🇸 Spain | 👗 Inditex | Retail | $147B |
| 🇧🇪 Belgium | 🍻 Anheuser-Busch InBev | Beverages | $116B |
| 🇸🇪 Sweden | 🛠️ Atlas Copco | Industrial Equipment | $80B |
| 🇮🇹 Italy | 🏎️ Ferrari | Automotive | $76B |
| 🇫🇮 Finland | 🏦 Nordea Bank | Banking | $40B |
| 🇦🇹 Austria | 🔌 Verbund AG | Energy | $26B |
| 🇱🇺 Luxembourg | 🏗️ Tenaris | Oil & Gas Equipment | $22B |
| 🇨🇿 Czech Republic | 💡 CEZ Group | Energy | $20B |
| 🇵🇱 Poland | ⛽ PKN Orlen | Energy | $20B |
| 🇵🇹 Portugal | 🔌 EDP Group | Energy | $16B |
| 🇬🇷 Greece | 🏦 Eurobank | Banking | $7B |
| 🇭🇺 Hungary | ⛽ MOL Group | Energy | $7B |
| 🇭🇷 Croatia | 🏦 Zagrebacka Banka | Banking | $6B |
| 🇷🇴 Romania | ⛽ Romgaz | Energy | $4B |
| 🇸🇮 Slovenia | 💊 Krka | Pharmaceuticals | $4B |
Note: Figures are rounded and last updated on April 15th, 2024. Countries with top publicly-traded companies worth under $4 billion are excluded.
Luxury supergiant LVMH—which owns brands like Tiffany, Christian Dior, and TAG Heuer to name a few—is Europe’s second largest company by market cap, at $420 billion.
Rounding out the top three is ASML, which produces equipment crucial to chip manufacturers, worth $380 billion.
When looking at the region, there is a vast disparity between EU member states and their most valuable companies.
For example, as mentioned earlier, Denmark’s Novo Nordisk and France’s LVMH are worth between $400-550 billion each. Meanwhile, some countries don’t even have a single publicly-listed company that is worth over $1 billion.
In fact, only 12 EU countries (less than half of the union) are home to the top 100 most valuable companies within the bloc. An additional four countries are represented if you look at the list of the top 200 companies.

-

 Technology7 days ago
All of the Grants Given by the U.S. CHIPS Act
-

 Misc2 weeks ago
How Hard Is It to Get Into an Ivy League School?
-

 Debt2 weeks ago
How Debt-to-GDP Ratios Have Changed Since 2000
-

 Sports2 weeks ago
The Highest Earning Athletes in Seven Professional Sports
-

 Science2 weeks ago
Visualizing the Average Lifespans of Mammals
-

 Brands1 week ago
How Tech Logos Have Evolved Over Time
-

 Energy1 week ago
Ranked: The Top 10 EV Battery Manufacturers in 2023
-

 Demographics1 week ago
Countries With the Largest Happiness Gains Since 2010