Investor Education
Opportunity Zones: Aligning Public and Private Capital

Opportunity Zones: Aligning Public and Private Capital
At the end of 2017, a potential $6.1 trillion in unrealized capital gains was available for reinvestment.
Throughout the U.S., unrealized capital gains have significant tax implications with enormous potential. Unrealized capital gains occur when the value of an asset has gone up on paper, but has not yet been sold for a profit. Taxes are triggered once the asset has been sold.
Investors can offset or defer these taxes in a few ways, including one new strategy: investing in opportunity zones.
Today’s infographic from Bedford Funds explains what opportunity zone funds are, their core benefits, and their potential impact across the country.
What is an Opportunity Zone?
Opportunity zones are U.S. Census tracts whose citizens experience economic distress.
Originating in the 2017 Tax Cuts and Jobs Act, they offer the potential to connect long-term capital with low-income communities across the country to drive return and impact.
How are opportunity zones chosen? The initial base is low-income census tracts, which have:
- Poverty rates of at least 20%; or
- Median family incomes lower than 80% of the surrounding area
The state’s governor or chief executive then nominates up to 25% of these areas as opportunity zones. Nationwide, a total of 8,700 opportunity zones exist, and 7.9 million of the areas’ residents live in poverty.
Overall, 35 million people live in these opportunity zones. There are a number of disparities between opportunity zones and notional averages across key variables:
| Poverty Rate | Median Family Income | Education* | |
|---|---|---|---|
| Opportunity Zones | 27.1% | $47,316 | 18.1% |
| National Average | 14.1% | $73,965 | 31.5% |
*Adult with Bachelor’s degree or higher
It’s evident these cities could benefit from increased investment.
What is an Opportunity Zone Fund?
An opportunity zone fund (OZF) is an investment vehicle that provides tax benefits for private capital to help revitalize economically distressed communities. Both operating businesses and real estate are eligible for investment.
Many investor types may take advantage of opportunity zone funds:
- Corporations– Also includes partnerships
- Accredited investors– Defined as high net worth individuals, brokers, and trusts
- Nonresident foreign investors– Only on capital gains earned in the U.S.
- Retail investors– Through funds that have lower minimums, though options are more limited
In addition to their wide eligibility, OZFs have a number of potential benefits.
Benefits
Tax breaks on capital gains can be organized into three tiers:
- Initial Tax Deferral– Once the previously-earned capital gains are channeled into a qualifying OZF, federal tax is deferred until December 31, 2026 or the date the investment is sold— whichever comes sooner
- Step-Up In Basis– 10% of the original capital gains will be excluded from federal taxes if an investment is held for five years
- Capital Gains Tax Exclusion– Federal tax on capital gains earned within the OZF is 100% eliminated if an investment is held for 10 years
All things being equal, OZFs realize after-tax outcomes that are over 40% higher than a standard portfolio investment. For example, the potential after-tax value of a $100 investment after a 10-year holding period would be as follows.
| Initial Investment | Net after-tax value | |
|---|---|---|
| OZF | $100 | $175.30 |
| Standard portfolio investment | $76.20 ($100- 23.8% capital gains tax) | $132.36 |
*Note: assumes long-term federal capital gains tax rate of 23.8%, no state income tax, and annual appreciation of 7% for both the OZF and alternative investment.
While it takes a few years to realize these tax benefits, OZFs have long-term horizons to encourage sustained investment with a lasting impact. The result is the potential for sustainable and equitable wealth creation.
Future Impact
Although real estate investments have captured significant attention, recent regulation has clarified that operating businesses are also eligible OZF investments.
By investing in businesses, OZFs can have a direct impact on economic growth and job creation.
Ultimately, OZFs have the potential to catalyze collective impact through their scalable operating company and real estate investments. Working directly with community leaders, OZFs can help drive long-term rejuvenation from within, versus gentrification from outside forces.
Opportunity zone funds are projected to raise $44 billion in capital designed specifically to invest in this future growth.
Investor Education
How MSCI Builds Thematic Indexes: A Step-by-Step Guide
From developing an index objective to choosing relevant stocks, this graphic breaks down how MSCI builds thematic indexes using examples.
How MSCI Builds Thematic Indexes: A Step-by-Step Guide
Have you ever wondered how MSCI builds its thematic indexes?
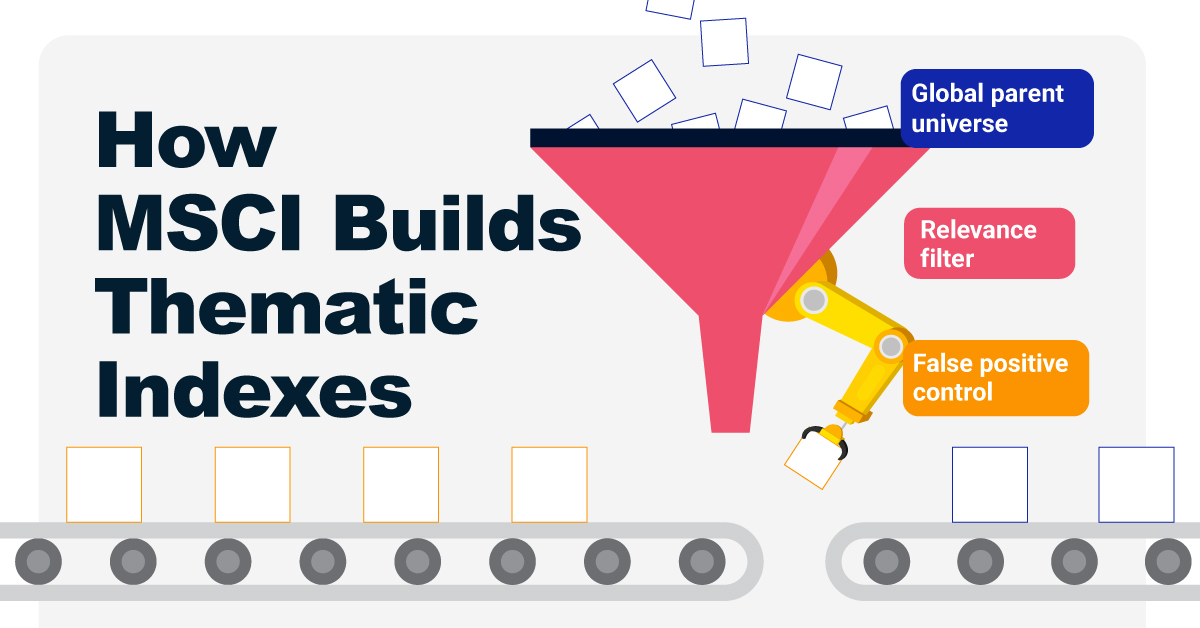
To capture long-term, structural trends that could drive business performance in the future, the company follows a systematic approach. This graphic from MSCI breaks down each step in the process used to create its thematic indexes.
Step 1: Develop an Index Objective
MSCI first builds a broad statement of what the theme aims to capture based on extensive research and insights from industry experts.
Steps 2 and 3: List Sub-Themes, Generate Keyword List
Together with experts, MSCI creates a list of sub-themes or “seedwords” to identify aligned business activities.
The team then assembles a collection of suitable documents describing the theme. Natural language processing efficiently analyzes word frequency and relevance to generate a more detailed set of keywords contextually similar to the seedwords.
Step 4: Find Relevant Companies
By analyzing financial reports, MSCI picks companies relevant to the theme using two methods:
- Direct approach: Revenue from a company’s business segment is considered 100% relevant if the segment name matches a theme keyword. Standard Industrial Classification (SIC) codes from these directly-matched segments make up the eligible SIC code list used in the indirect approach.
- Indirect approach: If a segment name doesn’t match theme keywords, MSCI will:
- Analyze the density of theme keywords mentioned in the company’s description. A minimum of two unique keywords is required.
- The keyword density determines a “discount factor” to reflect lower certainty in theme alignment.
- Revenue from business segments with an eligible SIC code, regardless of how they are named, is scaled down by the discount factor.
The total percentage of revenue applicable to the theme from both approaches determines a company’s relevance score.
Step 5: Select the Stocks
Finally, MSCI narrows down the stocks that will be included:
- Global parent universe: The ACWI Investable Market Index (IMI) is the starting point for standard thematic indexes.
- Relevance filter: The universe is filtered for companies with a relevance score of at least 25%.
- False positive control: Eligible companies that are mapped to un-related GICS sub-industries are removed.
Companies with higher relevance scores and market caps have a higher weighting in the index, with the maximum weighting for any one issuer capped at 5%. The final selected stocks span various sectors.
MSCI Thematic Indexes: Regularly Updated and Rules-Based
Once an index is built, it is reviewed semi-annually and updated based on:
- Changes to the parent index
- Changes at individual companies
- Theme developments based on expert input
Theme keywords are reviewed yearly in May. Overall, MSCI’s thematic index construction process is objective, scalable, and flexible. The process can be customized based on the theme(s) you want to capture.

Learn more about MSCI’s thematic indexes.

-

 Investor Education5 months ago
The 20 Most Common Investing Mistakes, in One Chart
Here are the most common investing mistakes to avoid, from emotionally-driven investing to paying too much in fees.
-
 Stocks10 months ago
Visualizing BlackRock’s Top Equity Holdings
BlackRock is the world’s largest asset manager, with over $9 trillion in holdings. Here are the company’s top equity holdings.
-
 Investor Education10 months ago
10-Year Annualized Forecasts for Major Asset Classes
This infographic visualizes 10-year annualized forecasts for both equities and fixed income using data from Vanguard.
-

 Investor Education1 year ago
Visualizing 90 Years of Stock and Bond Portfolio Performance
How have investment returns for different portfolio allocations of stocks and bonds compared over the last 90 years?
-
 Debt2 years ago
Countries with the Highest Default Risk in 2022
In this infographic, we examine new data that ranks the top 25 countries by their default risk.
-

 Markets2 years ago
The Best Months for Stock Market Gains
This infographic analyzes over 30 years of stock market performance to identify the best and worst months for gains.
-

 Real Estate2 weeks ago
Visualizing America’s Shortage of Affordable Homes
-

 Technology1 week ago
Ranked: Semiconductor Companies by Industry Revenue Share
-

 Money1 week ago
Which States Have the Highest Minimum Wage in America?
-

 Real Estate1 week ago
Ranked: The Most Valuable Housing Markets in America
-

 Business2 weeks ago
Charted: Big Four Market Share by S&P 500 Audits
-

 AI2 weeks ago
The Stock Performance of U.S. Chipmakers So Far in 2024
-

 Misc2 weeks ago
Almost Every EV Stock is Down After Q1 2024
-

 Money2 weeks ago
Where Does One U.S. Tax Dollar Go?

