Technology
The History of Wearable Technology
The History of Wearable Technology
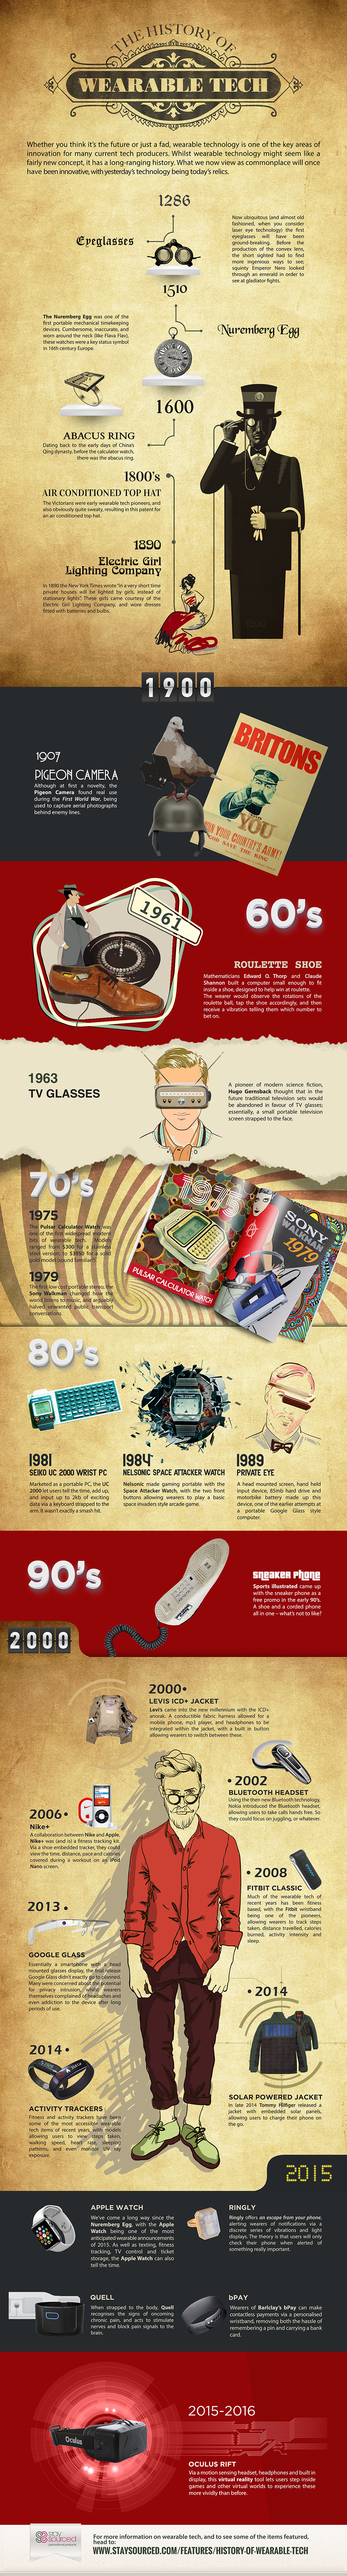
Today’s infographic not only highlights the history of wearable technology, but it also shows the noticeable acceleration in the advancement and adoption of new innovations. At the beginning, it would take hundreds of years between breakthroughs such as eyeglasses and the abacus ring. Today, new wearable tech innovations happen every month. In the last ten years, we’ve had the Google Glass, Fitbit, Oculus Rift, and countless others.
Interestingly, the history of wearable technology is littered with commercial failures and a few game changers, with not much in between. The reality is, however, that the duds seem to outweigh the successes by a wide margin.
For investors, this means that a strategic investment in a wearable tech company or product could either be a ten-bagger or go to zero. For this reason, due diligence is a key aspect of judging the validity of these companies.
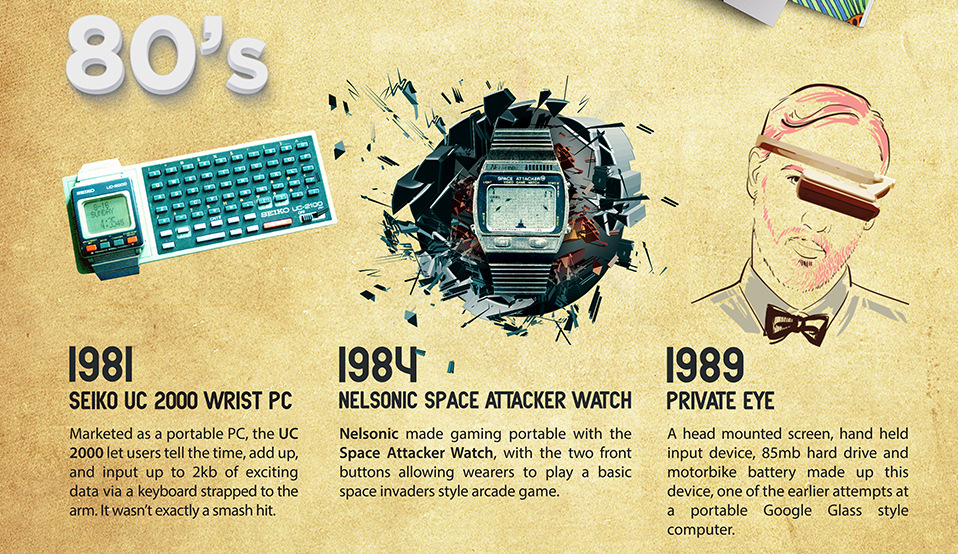
As examples, the air-conditioned hat, Pulsar Calculator Watch, Seiko UC 2000 Wrist PC, and Levi’s ICD+ Jacket never really took off. Even great technologies such as the Google Glass never really generated any returns. This was a lot of risk to take on for no return, but perhaps in the future these patents and knowledge can benefit a company like Google.
The clearest commercial success on the list happened in 1979. The Sony Walkman and subsequent Sony Discman helped put the company on track to become an entertainment powerhouse. Over 400 million Walkman portable music players have been sold over time, with about 200 million of those being cassette players.
However, not all products with good fanfare are destined for success. The commercial potential of many wearable technologies introduced in recent years are still up in the air.
Fitbit filed for a $100 million IPO, but it now has to compete against a plethora of other fitness trackers on the market. The Apple Watch has been launched to much fanfare, but it comes with no guarantees for Apple – a company that needs a lot of new revenues on a product to move the needle. Lastly, the creation of the Oculus Rift could pioneer virtual reality and bring it to consumers. The company was already bought by Facebook for $400 million in cash, $1.6 billion in stock, and an additional $300 million contingent on specific financial targets. Will this transaction ultimately benefit Facebook shareholders? While there are no guarantees, so far reviews have been overwhelmingly positive for the virtual reality device.
What is clear is that, based on the history of wearable technology, devices that move the masses are far and between. The successes that do make it, however, can change the world and generate chart-topping returns.
Original graphic by: Staysourced


Technology
All of the Grants Given by the U.S. CHIPS Act
Intel, TSMC, and more have received billions in subsidies from the U.S. CHIPS Act in 2024.


All of the Grants Given by the U.S. CHIPS Act
This was originally posted on our Voronoi app. Download the app for free on iOS or Android and discover incredible data-driven charts from a variety of trusted sources.
This visualization shows which companies are receiving grants from the U.S. CHIPS Act, as of April 25, 2024. The CHIPS Act is a federal statute signed into law by President Joe Biden that authorizes $280 billion in new funding to boost domestic research and manufacturing of semiconductors.
The grant amounts visualized in this graphic are intended to accelerate the production of semiconductor fabrication plants (fabs) across the United States.
Data and Company Highlights
The figures we used to create this graphic were collected from a variety of public news sources. The Semiconductor Industry Association (SIA) also maintains a tracker for CHIPS Act recipients, though at the time of writing it does not have the latest details for Micron.
| Company | Federal Grant Amount | Anticipated Investment From Company |
|---|---|---|
| 🇺🇸 Intel | $8,500,000,000 | $100,000,000,000 |
| 🇹🇼 TSMC | $6,600,000,000 | $65,000,000,000 |
| 🇰🇷 Samsung | $6,400,000,000 | $45,000,000,000 |
| 🇺🇸 Micron | $6,100,000,000 | $50,000,000,000 |
| 🇺🇸 GlobalFoundries | $1,500,000,000 | $12,000,000,000 |
| 🇺🇸 Microchip | $162,000,000 | N/A |
| 🇬🇧 BAE Systems | $35,000,000 | N/A |
BAE Systems was not included in the graphic due to size limitations
Intel’s Massive Plans
Intel is receiving the largest share of the pie, with $8.5 billion in grants (plus an additional $11 billion in government loans). This grant accounts for 22% of the CHIPS Act’s total subsidies for chip production.
From Intel’s side, the company is expected to invest $100 billion to construct new fabs in Arizona and Ohio, while modernizing and/or expanding existing fabs in Oregon and New Mexico. Intel could also claim another $25 billion in credits through the U.S. Treasury Department’s Investment Tax Credit.
TSMC Expands its U.S. Presence
TSMC, the world’s largest semiconductor foundry company, is receiving a hefty $6.6 billion to construct a new chip plant with three fabs in Arizona. The Taiwanese chipmaker is expected to invest $65 billion into the project.
The plant’s first fab will be up and running in the first half of 2025, leveraging 4 nm (nanometer) technology. According to TrendForce, the other fabs will produce chips on more advanced 3 nm and 2 nm processes.
The Latest Grant Goes to Micron
Micron, the only U.S.-based manufacturer of memory chips, is set to receive $6.1 billion in grants to support its plans of investing $50 billion through 2030. This investment will be used to construct new fabs in Idaho and New York.

-

 Education1 week ago
How Hard Is It to Get Into an Ivy League School?
-

 Technology2 weeks ago
Ranked: Semiconductor Companies by Industry Revenue Share
-

 Markets2 weeks ago
Ranked: The World’s Top Flight Routes, by Revenue
-

 Demographics2 weeks ago
Population Projections: The World’s 6 Largest Countries in 2075
-

 Markets2 weeks ago
The Top 10 States by Real GDP Growth in 2023
-

 Demographics2 weeks ago
The Smallest Gender Wage Gaps in OECD Countries
-

 Economy2 weeks ago
Where U.S. Inflation Hit the Hardest in March 2024
-

 Green2 weeks ago
Top Countries By Forest Growth Since 2001