Datastream
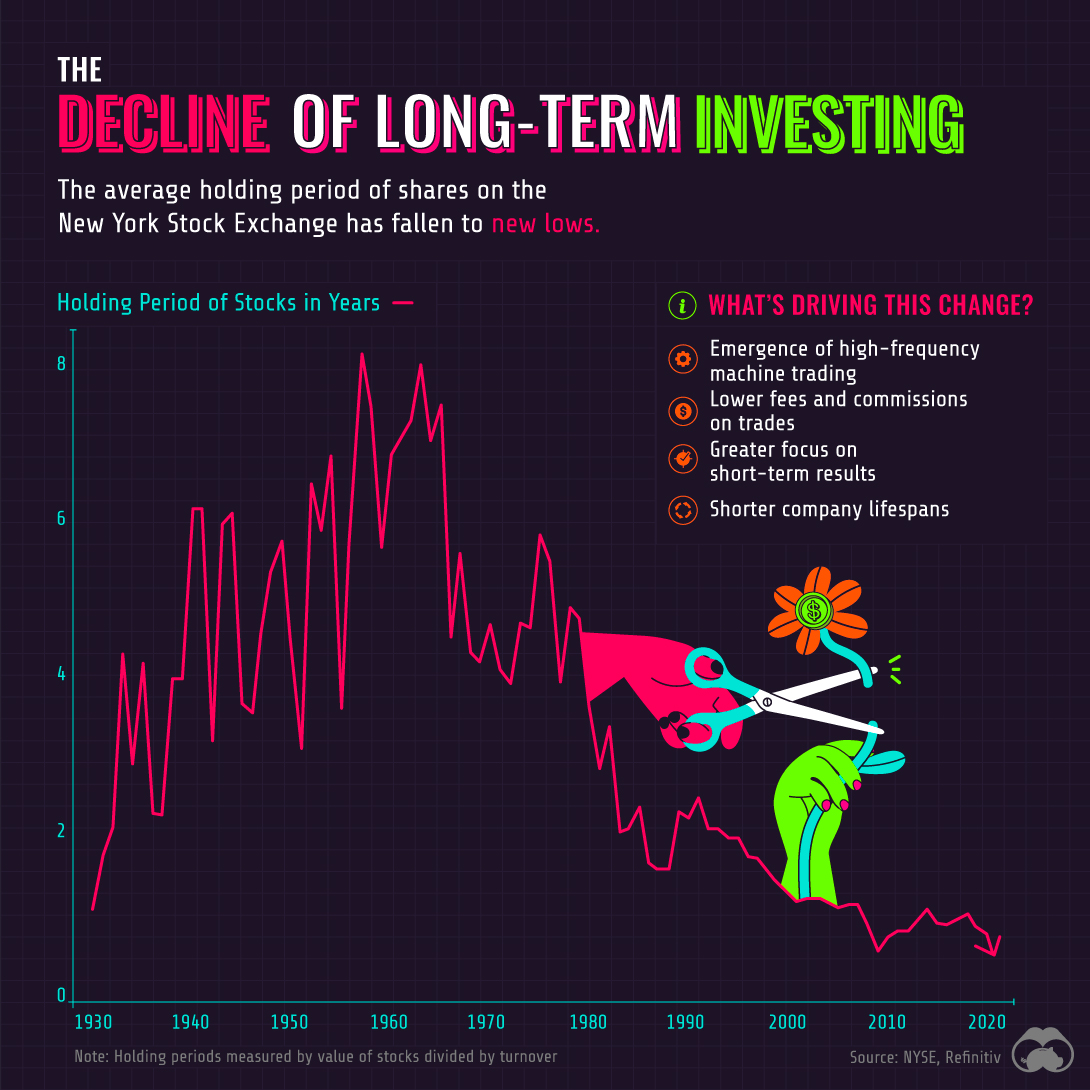
The Decline of Long-Term Investing
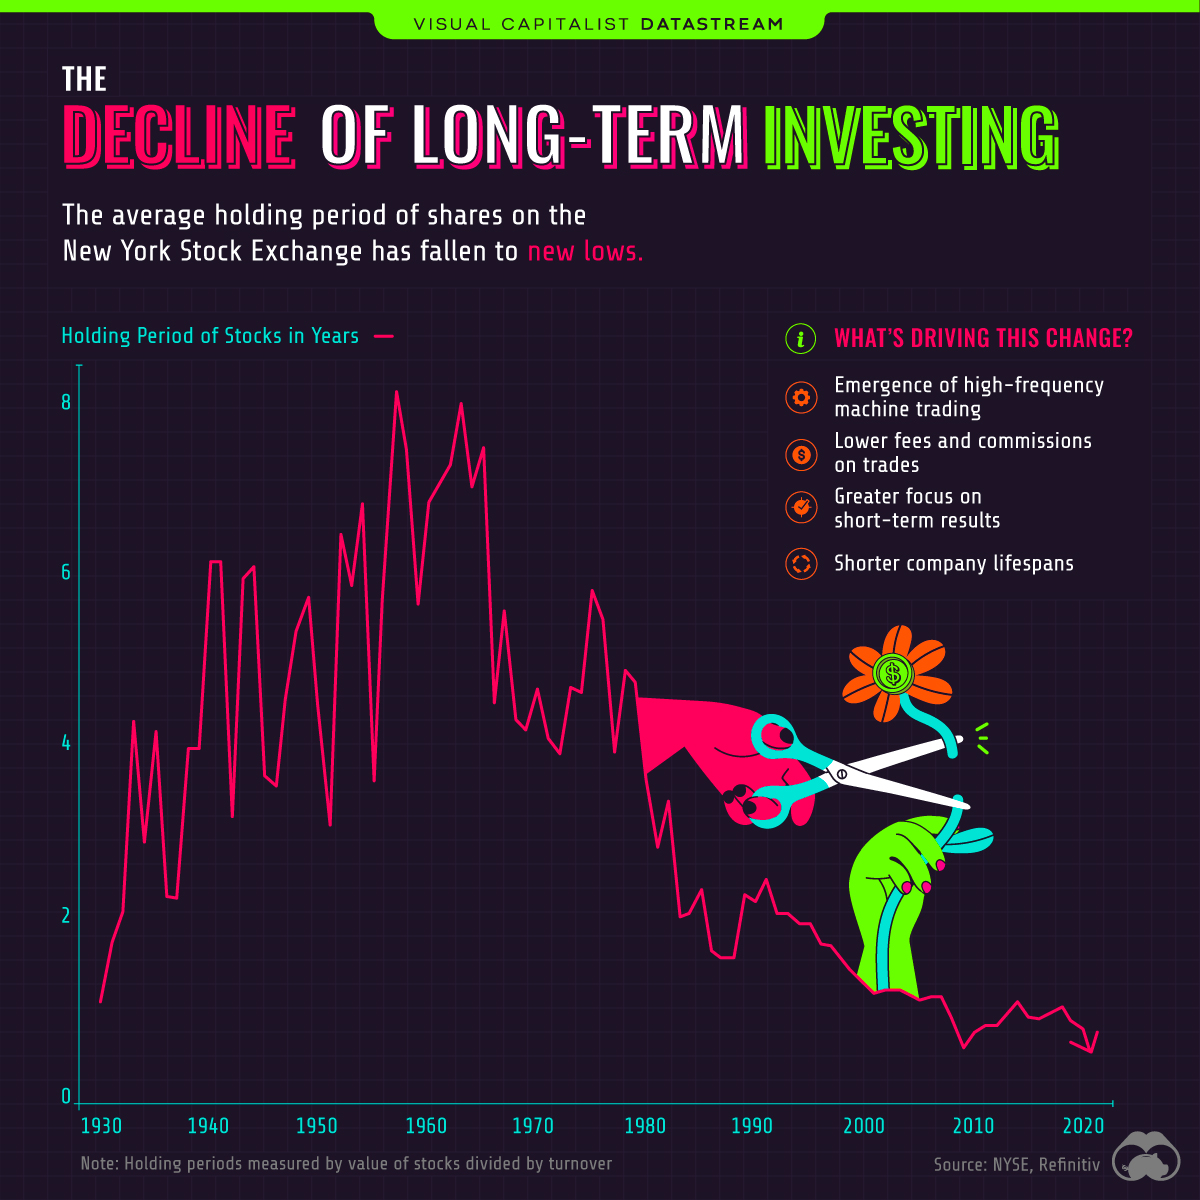


The Briefing
- The average holding period of shares on the New York Stock Exchange (NYSE) is now <1 year
- Technological advancement is one of the biggest drivers of this change
The Decline of Long-Term Investing
“Our favorite holding period is forever.”
Those are words from famed investor Warren Buffett, an advocate of the buy and hold approach to investing. Buy and hold is a long-term strategy in which shares are gradually accumulated over time, regardless of short-term performance.
And while Buffett is undoubtedly a successful investor, data from the NYSE suggests that few are actually following his advice. As of June 2020, the average holding period of shares was just 5.5 months. That’s a massive decrease from the late 1950s peak of 8 years.
What’s Driving This Change?
The decline in holding periods appears to have been caused by a number of factors, with the most prominent one being technological advancement.
For example, in 1966, the NYSE switched to a fully automated trading system. This greatly increased the number of trades that could be processed each day and lowered the cost of transactions.
| Year | NYSE Average Daily Trading Volume* (number of shares) |
|---|---|
| 1886 | 1M |
| 1982 | 100M |
| 1987 | 500M |
| 2020 | 1,000M |
*10 day moving average as of Dec. 15, 2020. Source: Nasdaq
Automated exchanges have led to the introduction of high-frequency trading (HFT), which uses computer algorithms to analyze markets and execute trades within seconds. HFT represents 50% of trading volume in U.S. equity markets, making it a significant contributor to the decline in holding periods.
Technology has enabled investors to become more active as well. Thanks to the internet and smartphones, new information is widely distributed and easy to access. With online trading platforms, investors also have the ability to act on this information immediately.
Social media is also playing a role. The recent r/wallstreetbets saga is an example of how the stock market can become sensational and fad-driven. After all, long-term investing has much less to offer in terms of excitement.
Corporate Longevity in Decline
Finally, companies themselves are also exhibiting shorter lifespans. This results in greater index turnover (companies being added or removed from stock indexes), and is likely a contributor to the decline in holding periods.
In 1970, companies that were included in the S&P 500 had an average tenure of 35 years. By 2018, average tenure was down to 20 years, and by 2030, it’s expected to fall below 15 years.
Altogether, these trends may be creating a greater incentive to pursue short-term results.


Datastream
Charting the Rise of Cross-Border Money Transfers (2015-2023)
With over 280 million immigrants transferring billions of dollars annually, the remittance industry has become more valuable than ever.
The Briefing
- 79% of remittance payments in 2022 were made to low and middle-income countries.
- Borderless, low-cost money transfer services like those provided by Wise can help immigrants support their families.
The Rise of Cross-Border Money Transfers
The remittance industry has experienced consistent growth recently, solidifying its position as a key component of the global financial landscape. Defined as the transfer of money from one country to another, usually to support a dependent, remittances play a pivotal role in providing food, healthcare, and education.
In this graphic, sponsored by Scottish Mortgage, we delve into the growth of the remittance industry, and the key factors propelling its success.
Powered by Immigration
With over 280 million immigrants worldwide, the remittance industry has an important place in our global society.
By exporting billions of dollars annually back to their starting nations, immigrants can greatly improve the livelihoods of their families and communities.
This is particularly true for low and middle-income countries, who in 2022 received, on average, 79% of remittance payments, according to Knomad, an initiative of the World Bank.
| Year | Low/Middle Income (US$ Billion) | World Total (US$ Billion) |
|---|---|---|
| 2015 | $447B | $602B |
| 2016 | $440B | $596B |
| 2017 | $477B | $638B |
| 2018 | $524B | $694B |
| 2019 | $546B | $722B |
| 2020 | $542B | $711B |
| 2021 | $597B | $781B |
| 2022 | $626B | $794B |
| 2023 | $639B | $815B |
India is one of the global leaders in receiving remittance payments. In 2022 alone, over $100 billion in remittances were sent to India, supporting many families.
Enter Wise
As the global remittance industry continues to grow, it is important to acknowledge the role played by innovative money transfer operators like Wise.
With an inclusive, user-centric platform and competitive exchange rates, Wise makes it easy and cost-effective for millions of individuals to send money home, worldwide.
Connection Without Borders
But Wise doesn’t just offer remittance solutions, the company offers a host of account services and a payment infrastructure that has helped over 6.1 million active customers move over $30 billion in the first quarter of 2023 alone.
Want to invest in transformative companies like Wise?
Discover Scottish Mortgage Investment Trust, a portfolio of some of the world’s most exciting growth companies.

-

 Education1 week ago
How Hard Is It to Get Into an Ivy League School?
-

 Technology2 weeks ago
Ranked: Semiconductor Companies by Industry Revenue Share
-

 Markets2 weeks ago
Ranked: The World’s Top Flight Routes, by Revenue
-

 Demographics2 weeks ago
Population Projections: The World’s 6 Largest Countries in 2075
-

 Markets2 weeks ago
The Top 10 States by Real GDP Growth in 2023
-

 Demographics2 weeks ago
The Smallest Gender Wage Gaps in OECD Countries
-

 Economy2 weeks ago
Where U.S. Inflation Hit the Hardest in March 2024
-

 Green2 weeks ago
Top Countries By Forest Growth Since 2001