Markets
The Big Pharma Takeover of Medical Cannabis

The Big Pharma Takeover of Medical Cannabis
As evidence of cannabis’ many benefits mounts, so does the interest from the global pharmaceutical industry, known as Big Pharma. The entrance of such behemoths will radically transform the cannabis industry—once heavily stigmatized, it is now a potentially game-changing source of growth for countless companies.
Today’s infographic comes to us from CB2 Insights, and explores how and why the notorious Big Pharma are interested in the nascent cannabis industry.
Who are “Big Pharma”?
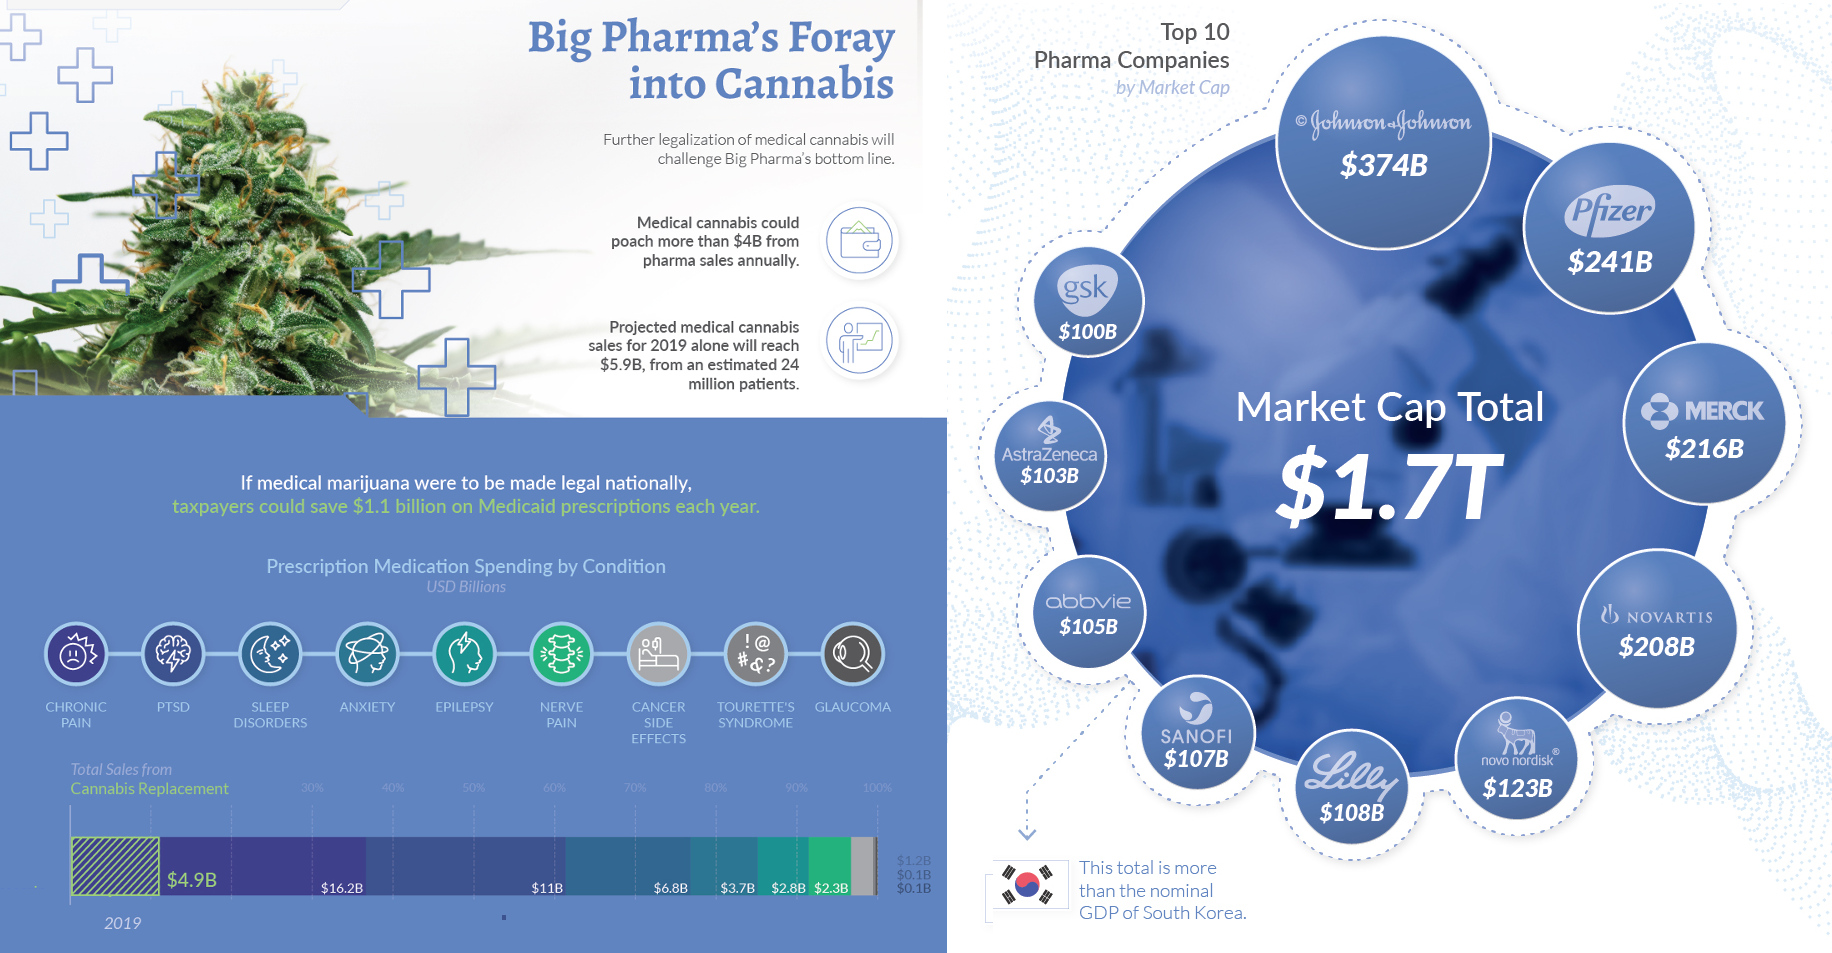
The term refers to some of the largest pharmaceutical companies in the world, considered especially influential as a group. To give a sense of their sheer size, the market cap of the top 10 Big Pharma companies is $1.7 trillion—Johnson & Johnson being the largest, with a market capitalization of $374 billion.
So far, Big Pharma has watched the cannabis industry from the sidelines, deterred by regulatory concerns. What we are seeing now is the sleeping giant’s takeover slowly intensifying as more patents, partnerships, and sponsored clinical trials come to fruition.
Could Cannabis be Sold Over the Counter?
The cannabis plant has been used in medicine for 6,000 years. However, there is still considerable debate around the role it plays in healthcare today. There are currently almost 400 active and completed clinical trials worldwide surrounding cannabidiol (CBD), a type of cannabinoid that makes up 40% of the cannabis plant’s extract.
Cannabis relies on CBD’s therapeutic properties, and recent studies suggest it may be useful in combating a variety of health conditions, such as:
- Epilepsy
- Schizophrenia
- Multiple sclerosis
- Migraines
- Arthritis
- Cancer side effects
As of 2019, 33 states and the District of Columbia have legalized cannabis for medical use. Its potential for pain management has led some experts to recommend it as an alternative to addictive painkillers, with one study of 13 states showing opiate-related deaths decreasing by over 33% in the six years since medical cannabis was legalized.
As the industry evolves, data is becoming increasingly important in understanding the potential of cannabis—both as a viable medical treatment, and as a recreational product. The shift away from anecdotal evidence towards big data will inform future policies, and give rise to a new era of consumer education.
Big Pharma’s Foray into Cannabis
Further legalization of cannabis will challenge Big Pharma’s bottom line, and poach more than $4 billion from pharma sales annually. In fact, medical cannabis sales are projected to reach $5.9 billion in 2019, from an estimated 24 million patients.
Seven of Canada’s top 10 cannabis patent holders are major multinational pharmaceutical companies, a trend that is not unique to Canada.
| Company Rank | 🇨🇦 Canadian Patents | Company Rank | 🇺🇸 U.S. Patents |
|---|---|---|---|
| 1. Novartis | 21 | 1. Abbvie | 59 |
| 2. Pfizer | 14 | 2. Sanofie | 39 |
| 3. GW Pharmaceuticals | 13 | 3. Merck | 35 |
| 4. Ericsson | 13 | 4. Bristol-Myers Squibb | 34 |
| 5. Merck | 11 | 5. GW Pharmaceuticals | 28 |
| 6. Solvay Pharmaceuticals | 7 | 6. Pfizer | 25 |
| 7. Kao Corporation | 7 | 7. Hebrew University of Jerusalem | 19 |
| 8. Ogeda SA | 7 | 8. Roche | 17 |
| 9. Sanofi | 6 | 9. University of Connecticut | 16 |
| 10. University of Connecticut | 6 | 10. U.S. Health and Human Services | 13 |
It comes as no surprise that many pharmaceutical giants have already formed strong partnerships with cannabis companies, such as Novartis and Tilray, who will develop and distribute medical cannabis together in legal jurisdictions around the world.
Data is the Missing Link
While the body of knowledge about the many uses of cannabis continue to grow, clinical evidence is key for widespread adoption.
Products backed by data will be a defining criteria for major companies to come into the market en masse. And ultimately, Big Pharma’s entry could accelerate public understanding and confidence in cannabis as a viable option for a range of ailments, and mark the next major milestone for the industry.


Markets
The European Stock Market: Attractive Valuations Offer Opportunities
On average, the European stock market has valuations that are nearly 50% lower than U.S. valuations. But how can you access the market?


European Stock Market: Attractive Valuations Offer Opportunities
Europe is known for some established brands, from L’Oréal to Louis Vuitton. However, the European stock market offers additional opportunities that may be lesser known.
The above infographic, sponsored by STOXX, outlines why investors may want to consider European stocks.
Attractive Valuations
Compared to most North American and Asian markets, European stocks offer lower or comparable valuations.
| Index | Price-to-Earnings Ratio | Price-to-Book Ratio |
|---|---|---|
| EURO STOXX 50 | 14.9 | 2.2 |
| STOXX Europe 600 | 14.4 | 2 |
| U.S. | 25.9 | 4.7 |
| Canada | 16.1 | 1.8 |
| Japan | 15.4 | 1.6 |
| Asia Pacific ex. China | 17.1 | 1.8 |
Data as of February 29, 2024. See graphic for full index names. Ratios based on trailing 12 month financials. The price to earnings ratio excludes companies with negative earnings.
On average, European valuations are nearly 50% lower than U.S. valuations, potentially offering an affordable entry point for investors.
Research also shows that lower price ratios have historically led to higher long-term returns.
Market Movements Not Closely Connected
Over the last decade, the European stock market had low-to-moderate correlation with North American and Asian equities.
The below chart shows correlations from February 2014 to February 2024. A value closer to zero indicates low correlation, while a value of one would indicate that two regions are moving in perfect unison.
| EURO STOXX 50 | STOXX EUROPE 600 | U.S. | Canada | Japan | Asia Pacific ex. China |
|
|---|---|---|---|---|---|---|
| EURO STOXX 50 | 1.00 | 0.97 | 0.55 | 0.67 | 0.24 | 0.43 |
| STOXX EUROPE 600 | 1.00 | 0.56 | 0.71 | 0.28 | 0.48 | |
| U.S. | 1.00 | 0.73 | 0.12 | 0.25 | ||
| Canada | 1.00 | 0.22 | 0.40 | |||
| Japan | 1.00 | 0.88 | ||||
| Asia Pacific ex. China | 1.00 |
Data is based on daily USD returns.
European equities had relatively independent market movements from North American and Asian markets. One contributing factor could be the differing sector weights in each market. For instance, technology makes up a quarter of the U.S. market, but health care and industrials dominate the broader European market.
Ultimately, European equities can enhance portfolio diversification and have the potential to mitigate risk for investors.
Tracking the Market
For investors interested in European equities, STOXX offers a variety of flagship indices:
| Index | Description | Market Cap |
|---|---|---|
| STOXX Europe 600 | Pan-regional, broad market | €10.5T |
| STOXX Developed Europe | Pan-regional, broad-market | €9.9T |
| STOXX Europe 600 ESG-X | Pan-regional, broad market, sustainability focus | €9.7T |
| STOXX Europe 50 | Pan-regional, blue-chip | €5.1T |
| EURO STOXX 50 | Eurozone, blue-chip | €3.5T |
Data is as of February 29, 2024. Market cap is free float, which represents the shares that are readily available for public trading on stock exchanges.
The EURO STOXX 50 tracks the Eurozone’s biggest and most traded companies. It also underlies one of the world’s largest ranges of ETFs and mutual funds. As of November 2023, there were €27.3 billion in ETFs and €23.5B in mutual fund assets under management tracking the index.
“For the past 25 years, the EURO STOXX 50 has served as an accurate, reliable and tradable representation of the Eurozone equity market.”
— Axel Lomholt, General Manager at STOXX
Partnering with STOXX to Track the European Stock Market
Are you interested in European equities? STOXX can be a valuable partner:
- Comprehensive, liquid and investable ecosystem
- European heritage, global reach
- Highly sophisticated customization capabilities
- Open architecture approach to using data
- Close partnerships with clients
- Part of ISS STOXX and Deutsche Börse Group
With a full suite of indices, STOXX can help you benchmark against the European stock market.
Learn how STOXX’s European indices offer liquid and effective market access.

-

 Economy2 days ago
Economic Growth Forecasts for G7 and BRICS Countries in 2024
The IMF has released its economic growth forecasts for 2024. How do the G7 and BRICS countries compare?
-

 Markets1 week ago
U.S. Debt Interest Payments Reach $1 Trillion
U.S. debt interest payments have surged past the $1 trillion dollar mark, amid high interest rates and an ever-expanding debt burden.
-

 United States2 weeks ago
Ranked: The Largest U.S. Corporations by Number of Employees
We visualized the top U.S. companies by employees, revealing the massive scale of retailers like Walmart, Target, and Home Depot.
-

 Markets2 weeks ago
The Top 10 States by Real GDP Growth in 2023
This graphic shows the states with the highest real GDP growth rate in 2023, largely propelled by the oil and gas boom.
-

 Markets2 weeks ago
Ranked: The World’s Top Flight Routes, by Revenue
In this graphic, we show the highest earning flight routes globally as air travel continued to rebound in 2023.
-

 Markets2 weeks ago
Ranked: The Most Valuable Housing Markets in America
The U.S. residential real estate market is worth a staggering $47.5 trillion. Here are the most valuable housing markets in the country.


-

 Energy1 week ago
The World’s Biggest Nuclear Energy Producers
-

 Money2 weeks ago
Which States Have the Highest Minimum Wage in America?
-

 Technology2 weeks ago
Ranked: Semiconductor Companies by Industry Revenue Share
-
Markets2 weeks ago
Ranked: The World’s Top Flight Routes, by Revenue
-

 Countries2 weeks ago
Population Projections: The World’s 6 Largest Countries in 2075
-
Markets2 weeks ago
The Top 10 States by Real GDP Growth in 2023
-

 Demographics2 weeks ago
The Smallest Gender Wage Gaps in OECD Countries
-

 United States2 weeks ago
Where U.S. Inflation Hit the Hardest in March 2024