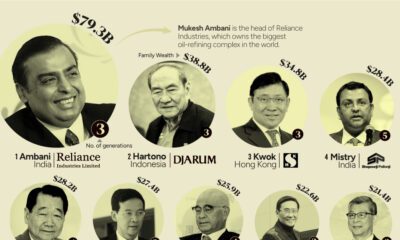

This graphic shows the 15 richest families in Asia. From energy to banking, these dynasties have built fortunes across many sectors.
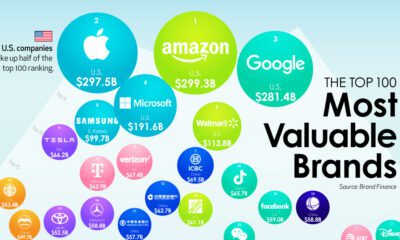

We show the top companies by brand value—and the brands that are rising the fastest as consumer expectations shift.
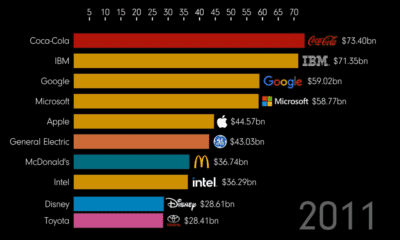

How much money is in a brand? And which brands have risen and fallen? This animation tracks the most valuable brands over 20+ years
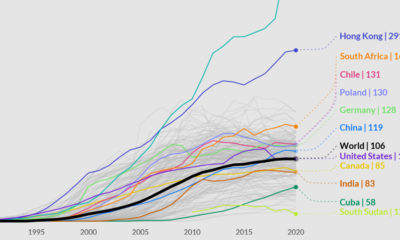

This chart shows the growth of mobile device subscriptions since 1990, around the world and in select countries.
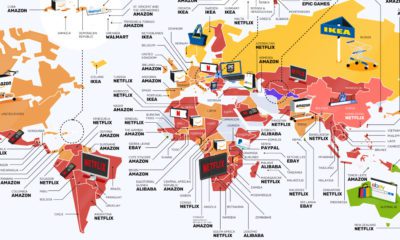

From Netflix to IKEA, this map of the world highlights the most searched for consumer brands around the world.
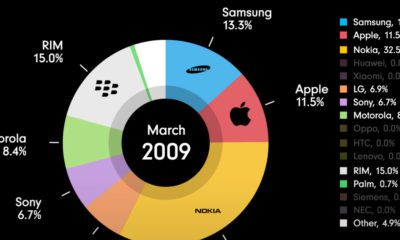

This animation chronicles the evolution of the mobile phone market, showing the rise and fall of various mobile phone manufacturers.
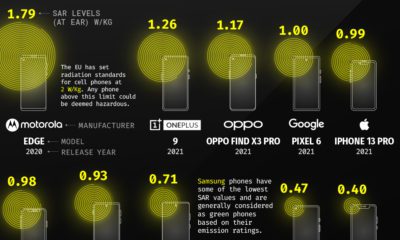

The parameter used to measure phone radiation emissions is the SAR value. Here we visualize the SAR values of some popular smartphones.
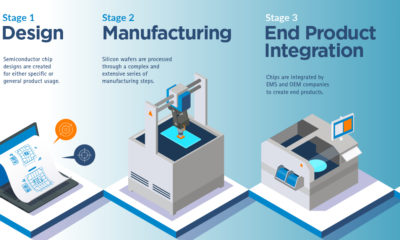

From smartphones to cars and factories, the semiconductor supply chain powers our entire digital economy.
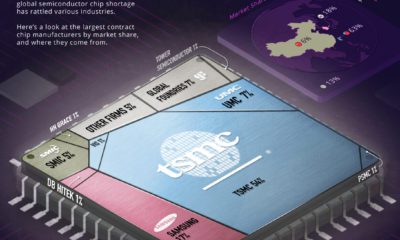

The global semiconductor shortage has affected several industries. Here's a look at the 10 largest semiconductor companies by market share.
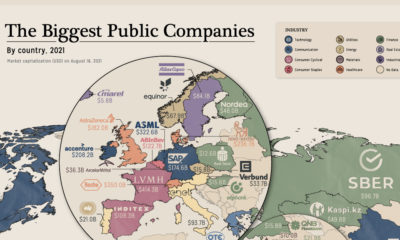

Tech, finance or energy giant? We mapped the biggest companies by market cap and industry.


 Creator Program