

With Russia’s revenues from fossil fuel exports having declined significantly, which countries are still importing Russian fossil fuels?


The oil market is bigger than the 10 largest metal markets combined, with production value exceeding $2 trillion annually.
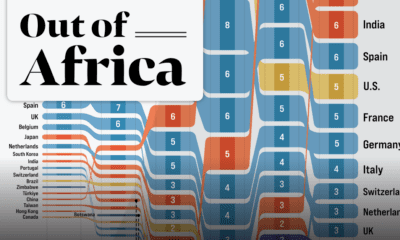

In 2020 the African continent exported nearly $378 billion worth of goods. Here are the top destinations for 25 years of Africa’s exports.


How much oil is saved by adding electric vehicles into the mix? We look at data from 2015 to 2025P for different types of EVs.


The commodities-to-equities ratio recently hit a 50-year low. In the past, when this ratio reached such levels, commodity supercycles began.
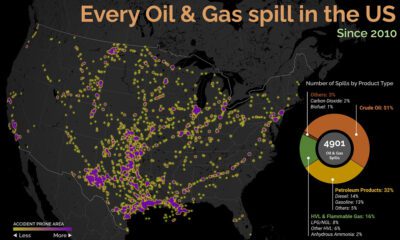

Oil and gas spills can be messy, but where are they most likely to occur? This graphic looks at oil and gas spills in the U.S....
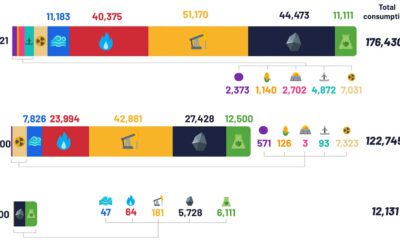

Despite the advent of renewable sources of energy, fossil fuels and their carbon emissions, haven’t gone anywhere.


While Russia still makes billions from fossil fuel exports, revenues are declining. Here are the largest importers since the start of the invasion.
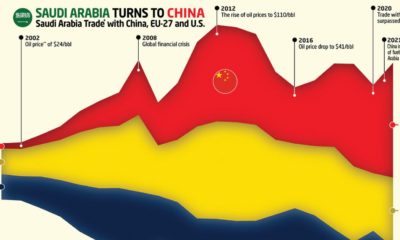

This graphic charts Saudi Arabia’s trading history with the EU, the U.S., and it's new largest trading partner — China.


As Europe and the EU shift away from fossil fuels, which energy sources are European countries depending on for their electricity generation?


 Creator Program