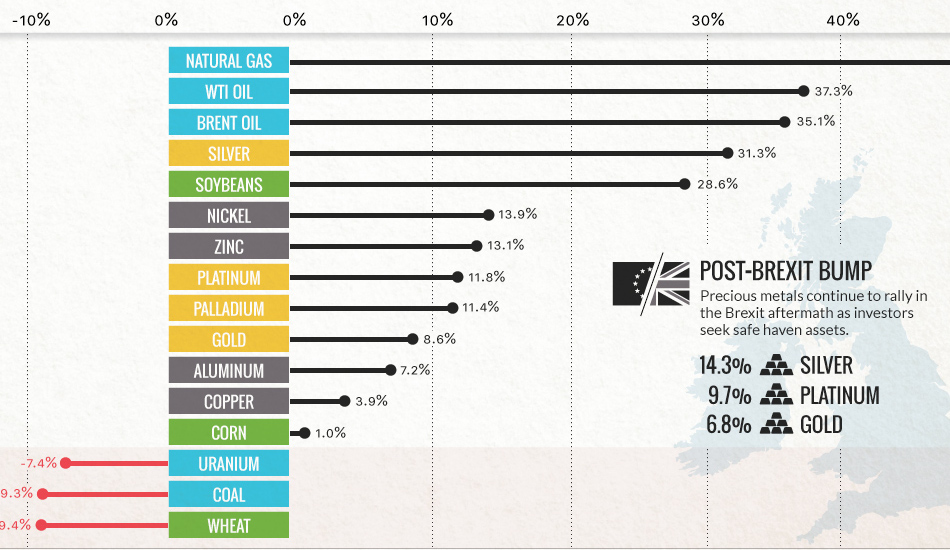
Commodities are back! Precious metals hit two-year highs post-Brexit, while oil and natural gas had their best quarter in years.
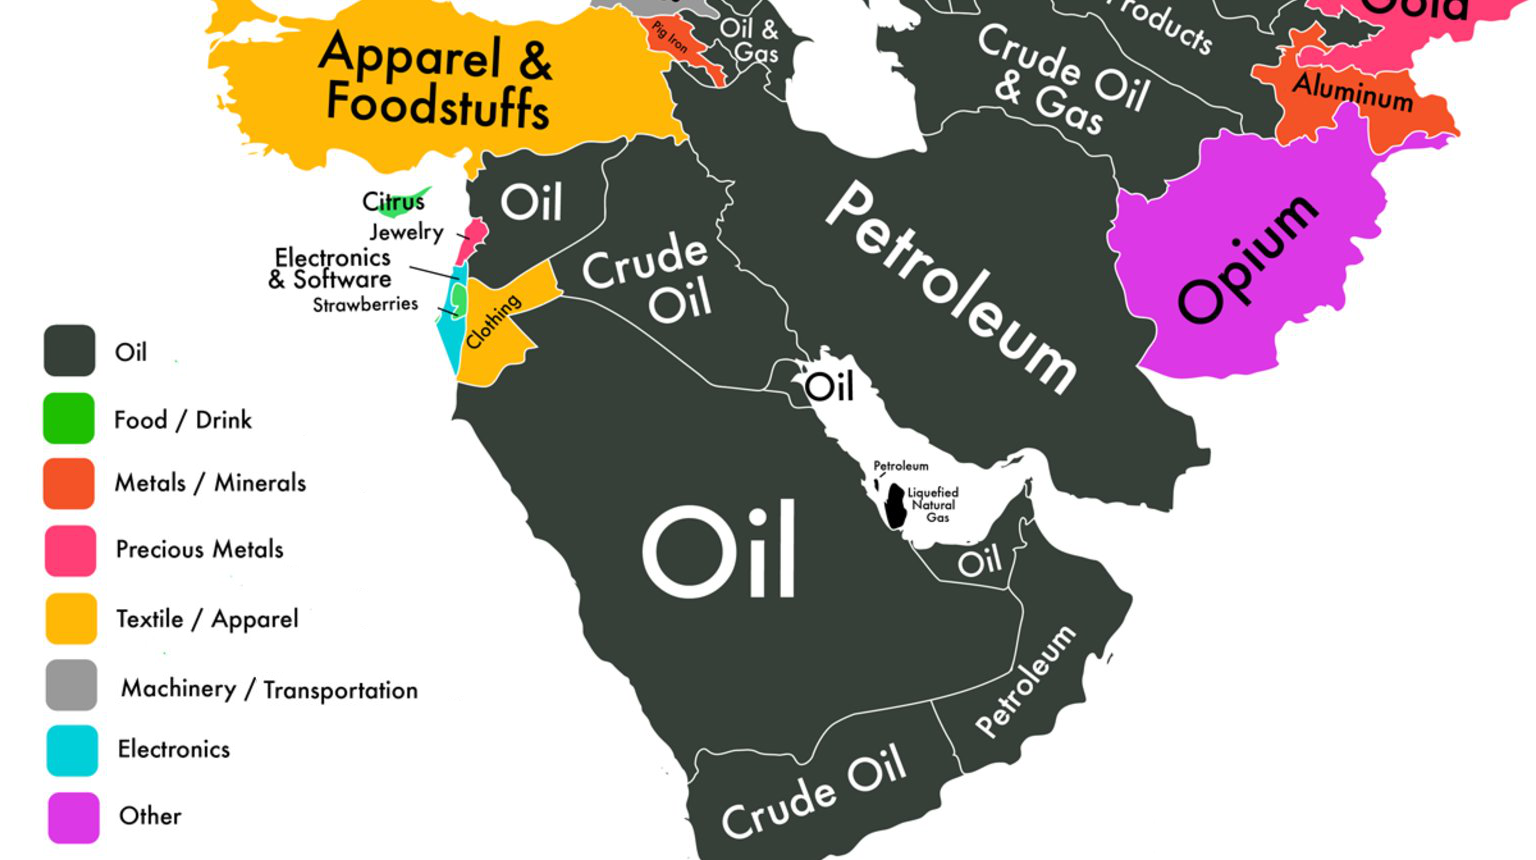
If we could only show you one map to explain the economy of the Middle East, it would be this one.
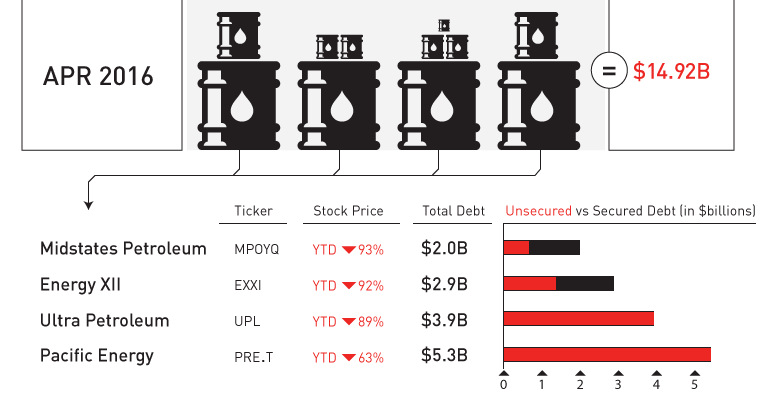
April was a record-setting month for bankruptcies in the oil patch. We put the 11 bankruptcies and $15 billion of outstanding debt in context.
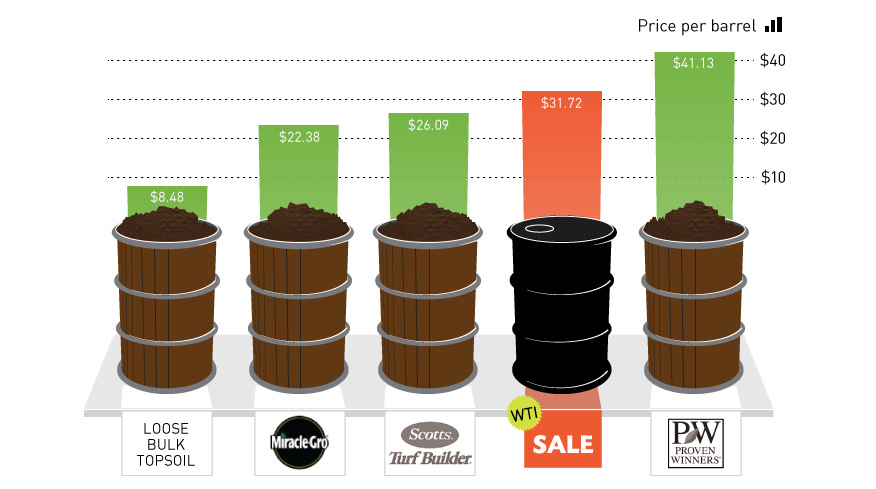
It costs the same amount as a barrel of Scotts Turf Builder.
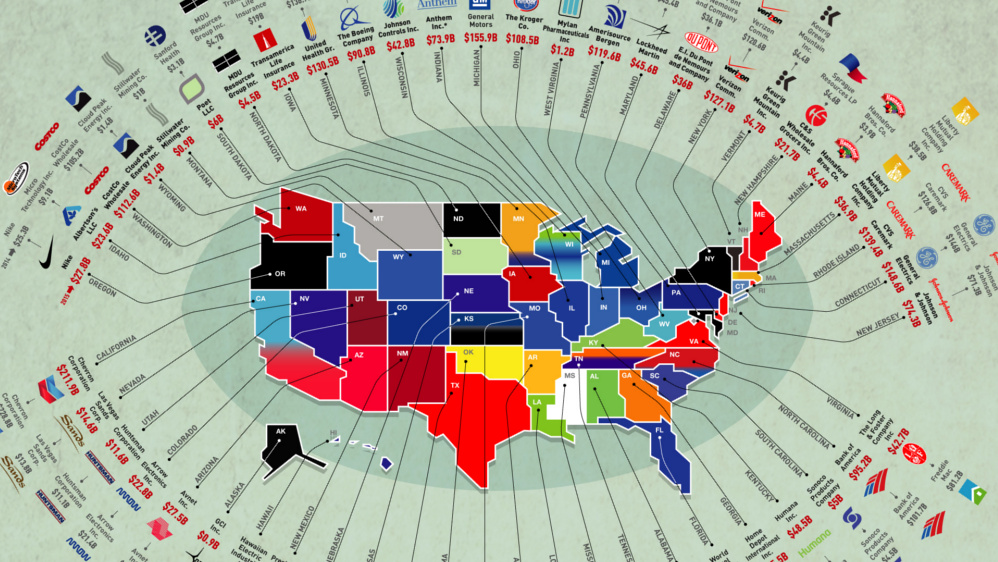
The biggest businesses in the U.S. range from oil producers to retail giants. Here's a list showing the largest company in each state by revenue.
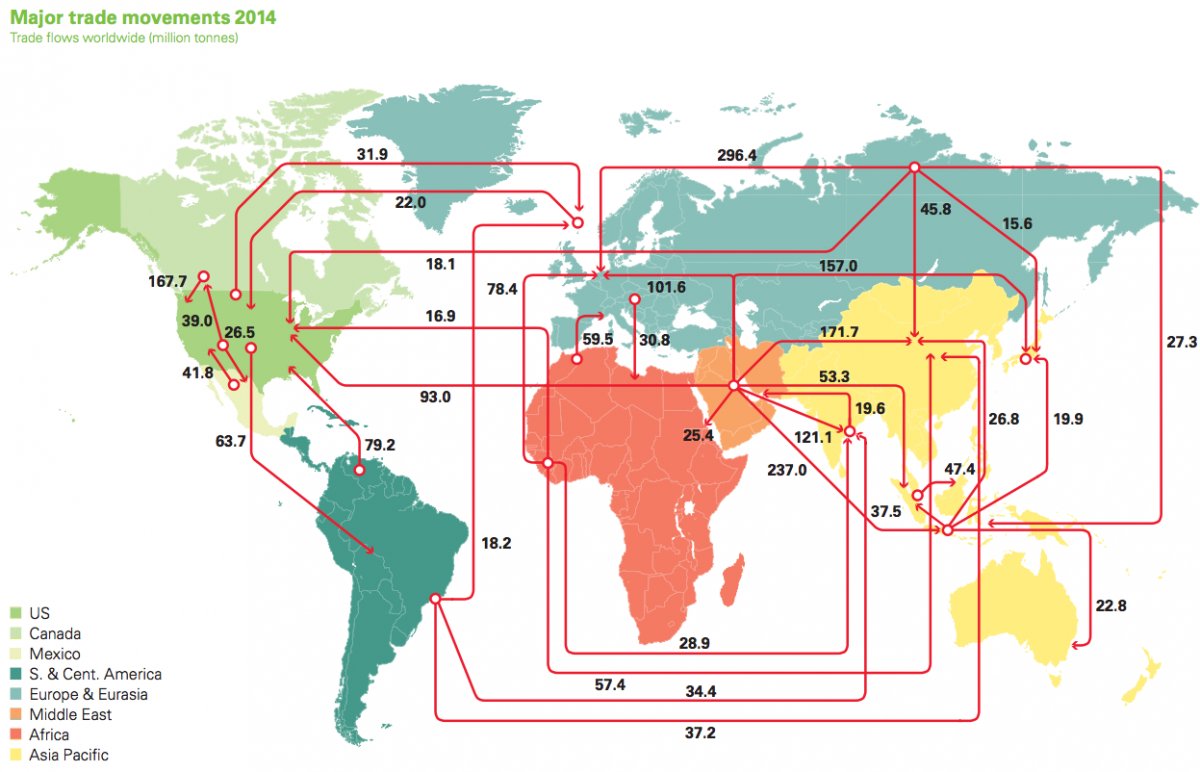
Every day, 93 million barrels of oil are consumed by the global economy. How does this oil change hands? This map visualizes the global oil trade.
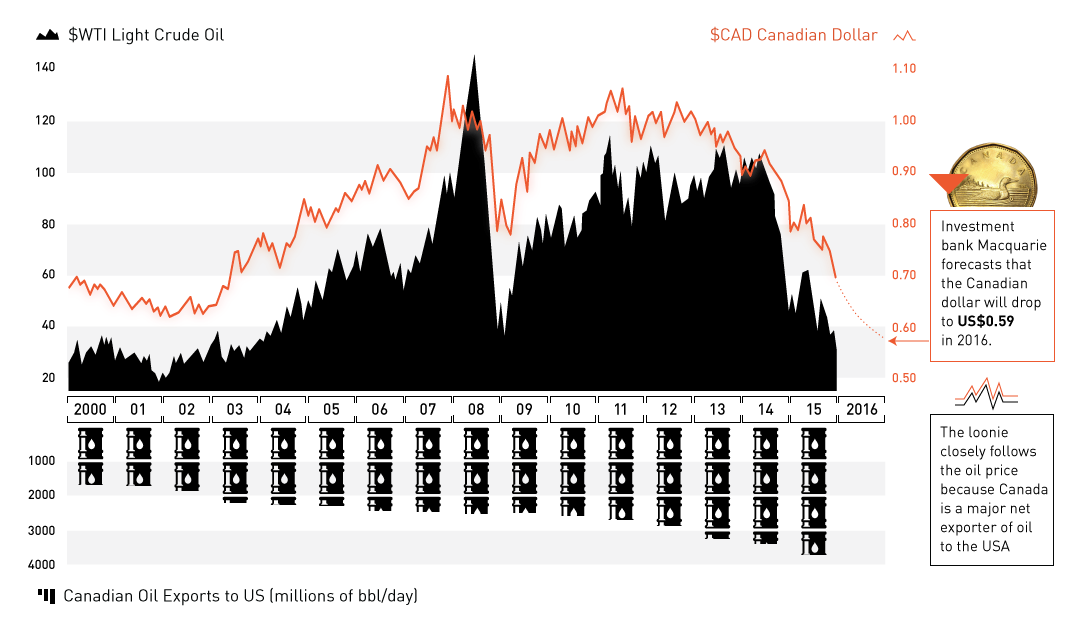
The oil plunge has wreaked havoc on the Canadian dollar. Now at 13-yr lows and expected to go lower, we explain the relationship between oil and...
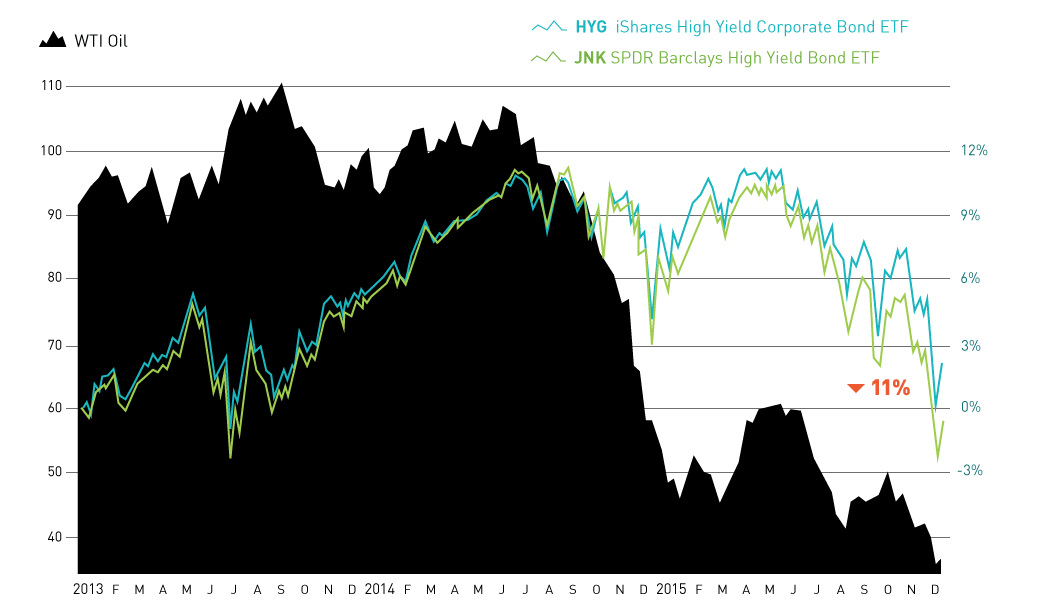
The month of December so far has seen a mini-meltdown in the junk bond market. The culprit? Fringe oil and gas producers that are struggling with...
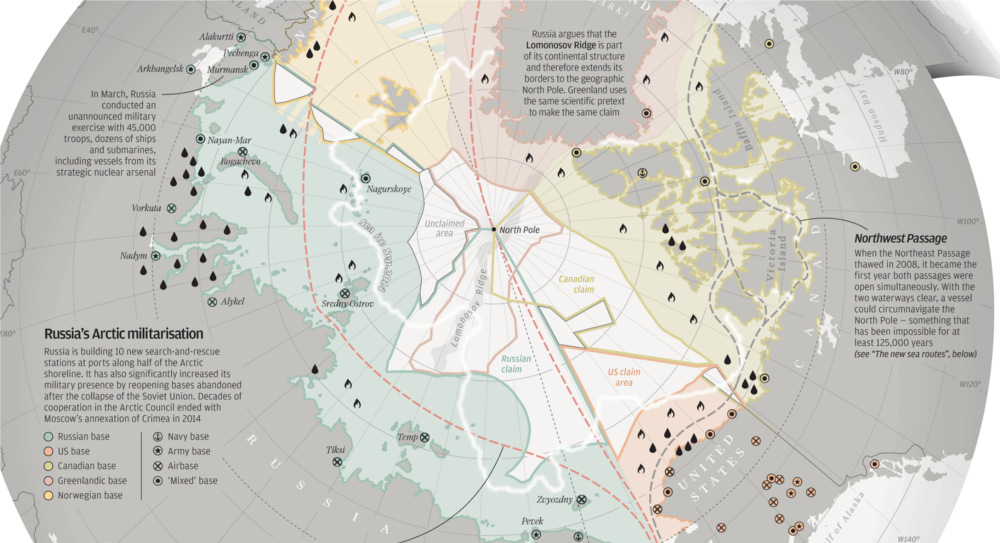
With Arctic ice thawing, the race for natural resources, shipping routes, and other territorial claims is heating up. The race for Arctic Domination is on.
The 10 largest oil companies generated a massive $3.26 trillion in revenue last year. How did Big Oil come to be? This infographic takes a look.


