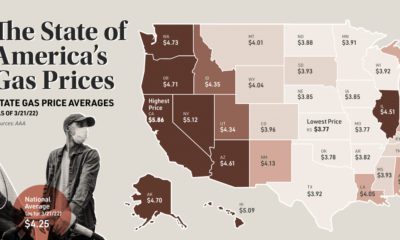

This map looks at gas prices across various states, and historical context for today's sky-high prices at the pump.
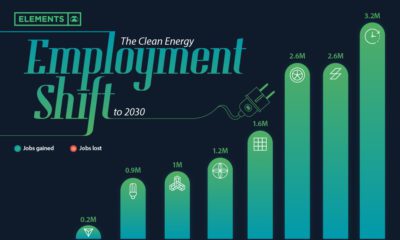

Will the clean energy transition create jobs, or will jobs be lost? Here is projected employment growth in clean energy and related sectors to 2030.
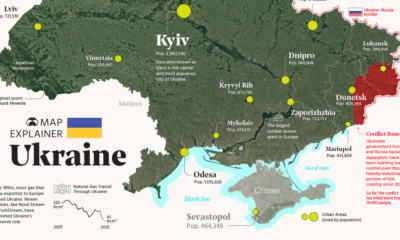

Ukraine has made the headlines due to the ongoing tensions with Russia. In this map infographic, we examine Ukraine from a structural point of view.
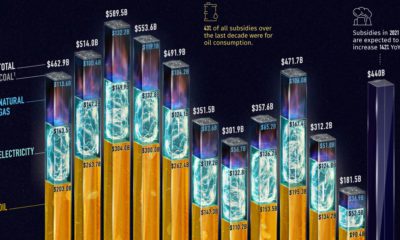

Governments pour nearly $500 billion into fossil fuel subsidies annually. This chart breaks down fossil fuel subsidies between 2010 and 2021.
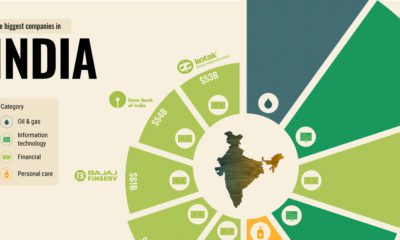

What are the biggest companies in India, one of the largest and most populated countries in the world?
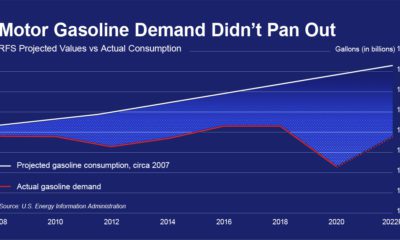

Biofuel mandates were passed in 2005, this graphic shows why they've become out of touch with modern transportation and are costing billions.
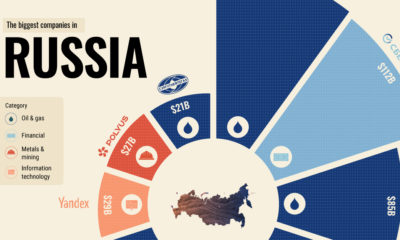

Here are the top 10 biggest companies in Russia, the largest country in the world.
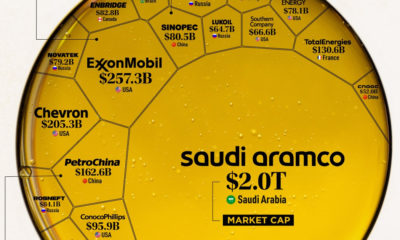

Oil still makes up the largest share of the global energy mix. Here are the largest oil and gas companies by market cap in 2021.
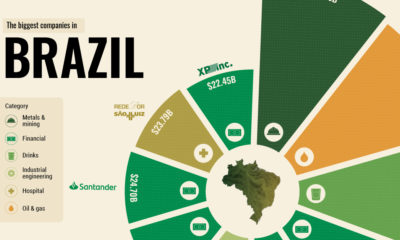

What drives some of the world’s emerging economies? From natural resources to giant banks, here are the top 10 biggest companies in Brazil.
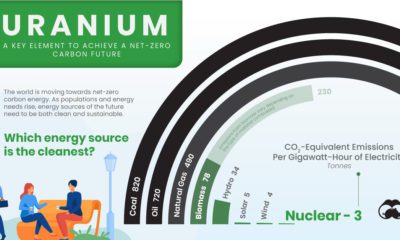

All energy sources have negative impacts, but some are better for the environment than others. Which energy source is the cleanest?


