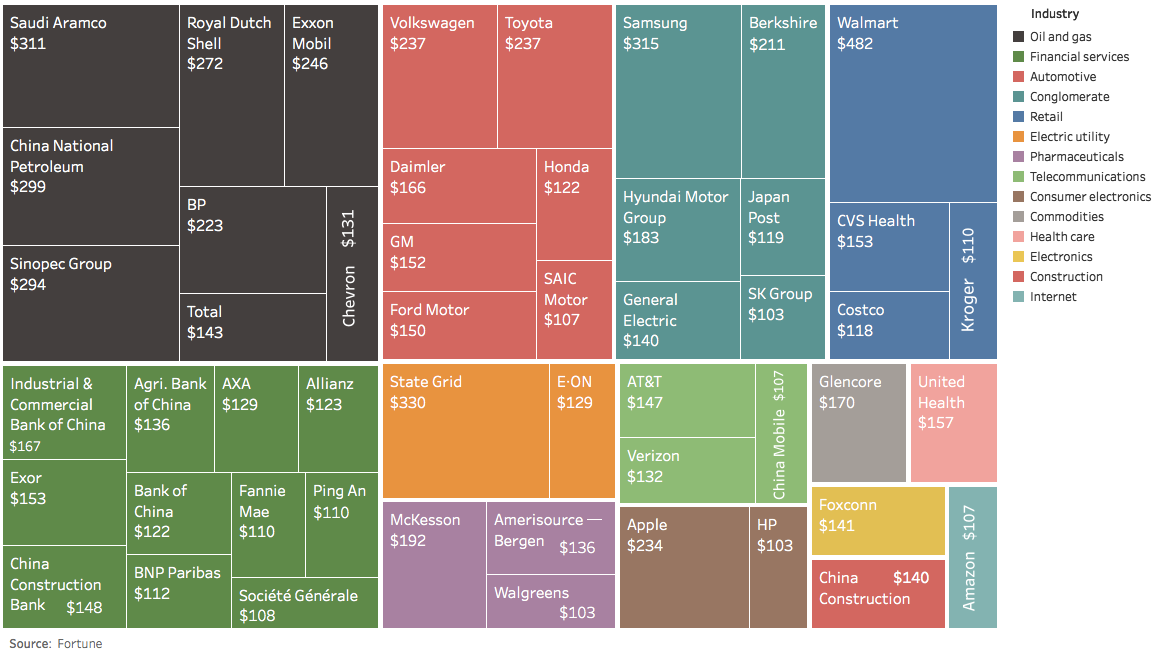
The usual oil companies and banks dominate the list of the largest 50 companies by revenue - but there are also some lesser knowns worth learning...
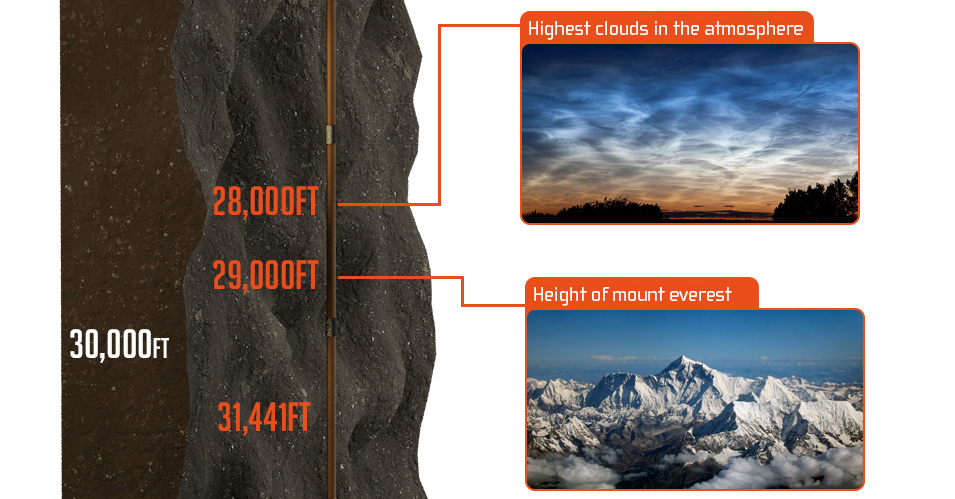
In a remote part of eastern Russia, the world's deepest oil well has been drilled to incredible depths - potentially unlocking a shelf of 2.3 billion...
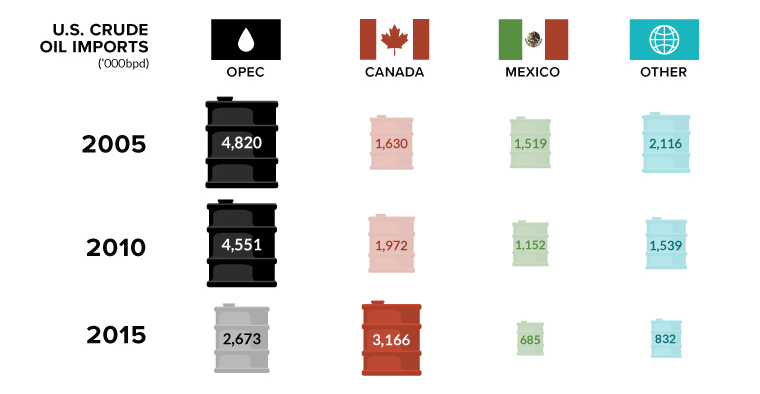
Canada is in, and OPEC is out. In this week's chart on oil imports, we also look at the declining influence of the world's most infamous...
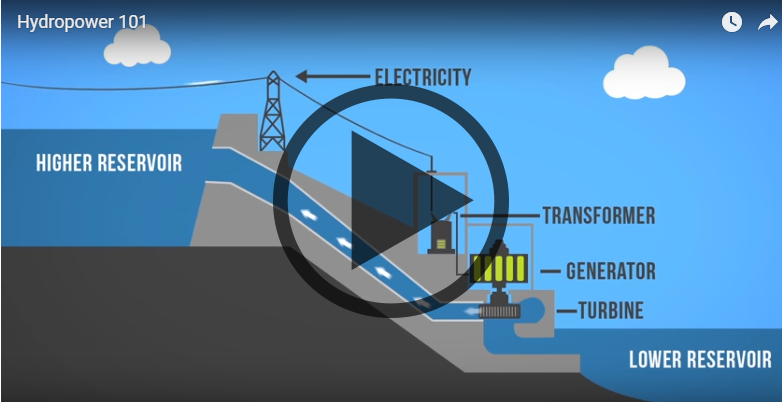
Want to learn about how different energy sources work? Check out these short, fact-driven videos on topics like oil, hydro, solar, wind, LNG, or fracking.
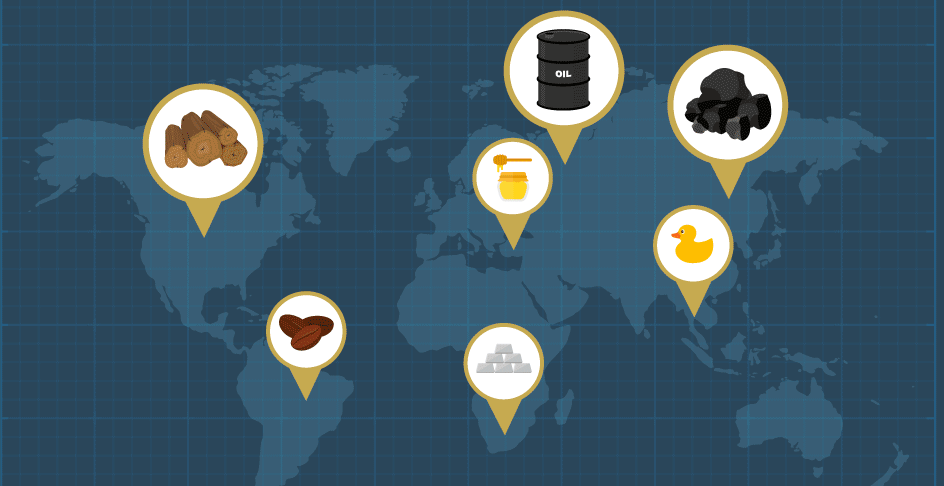
Every “thing” comes from somewhere. Whether we are talking about an iPhone or a battery, even the most complex technological device is made up of the...
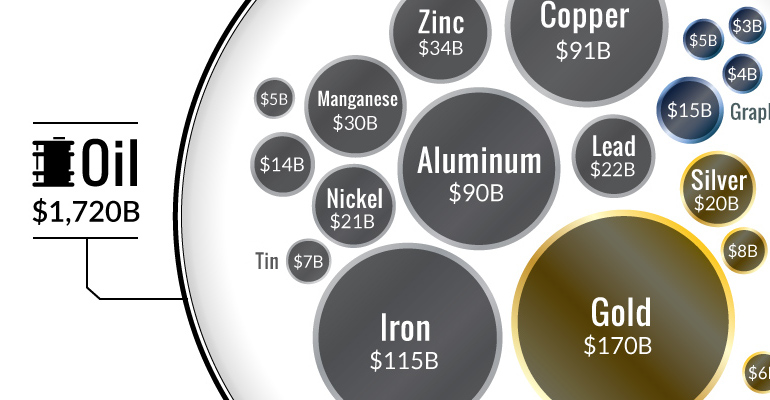
Ever wonder why the oil industry has so much influence? This chart shows that all metal markets combined don't even come close to touching the oil...
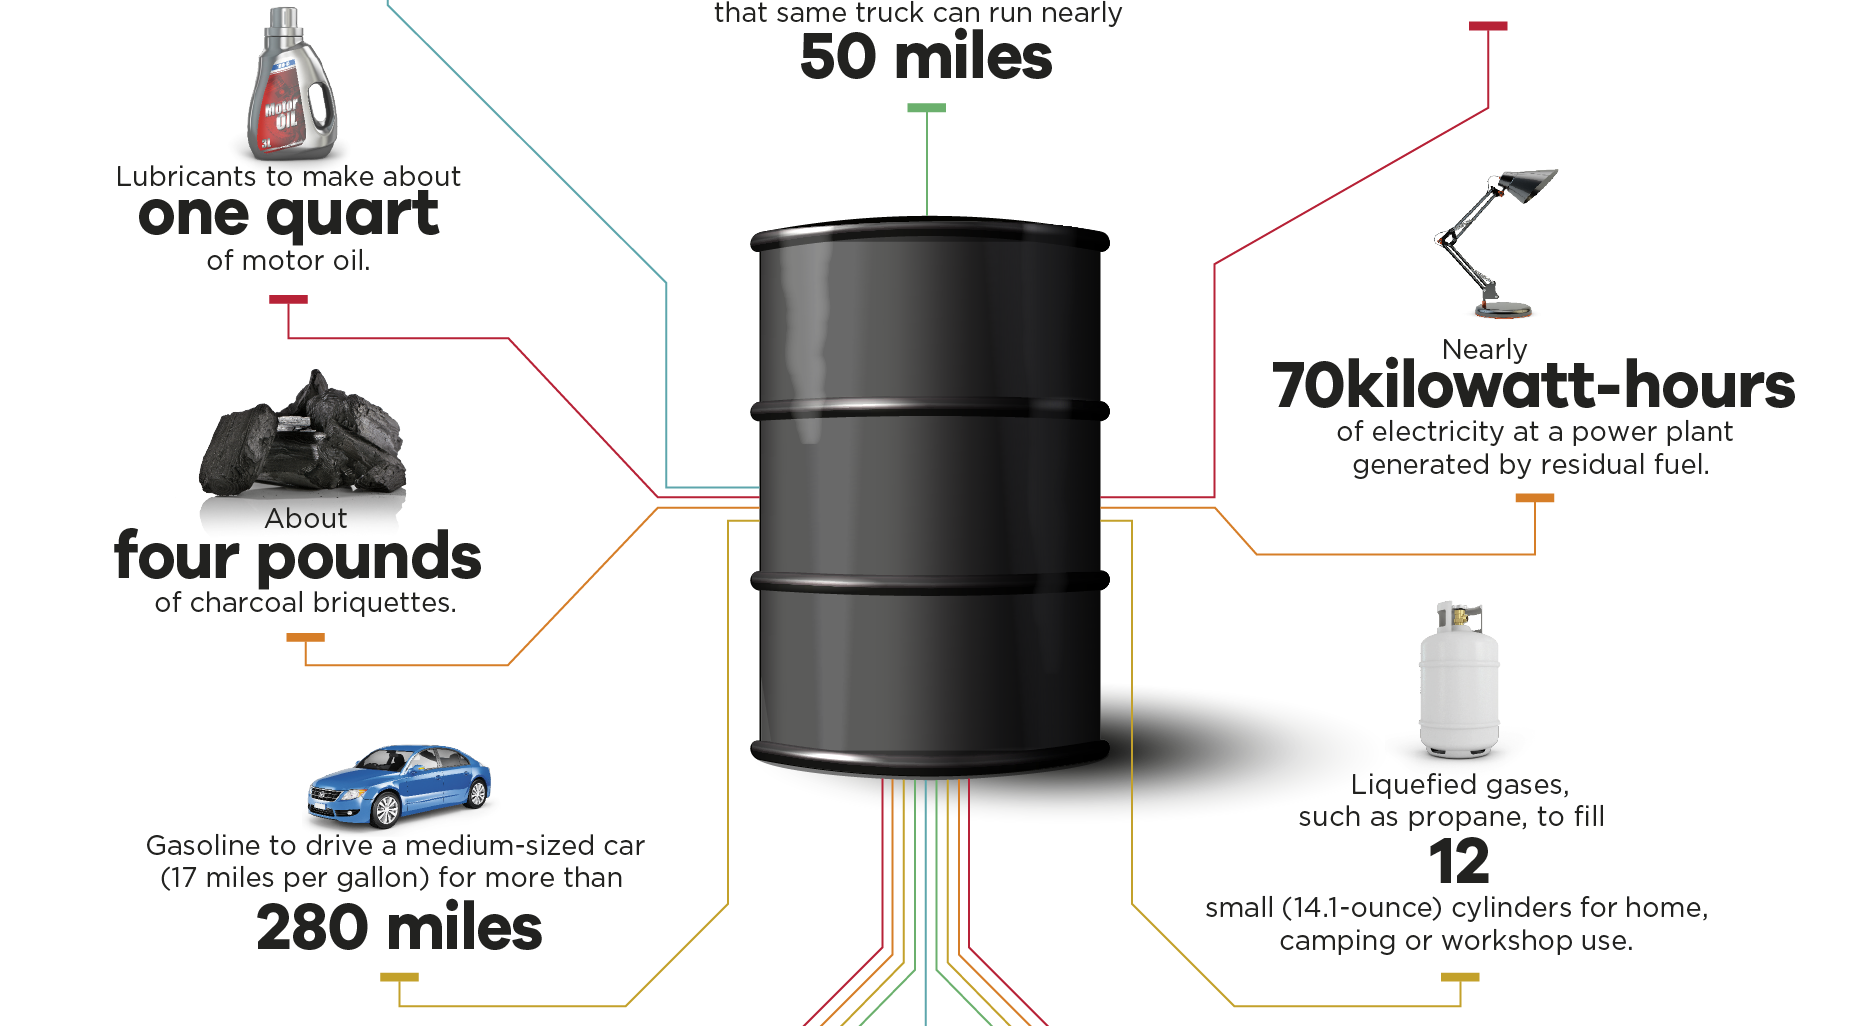
You may think of oil as the gooey black stuff used to make gasoline. However, it has thousands of applications - here's what comes from one...
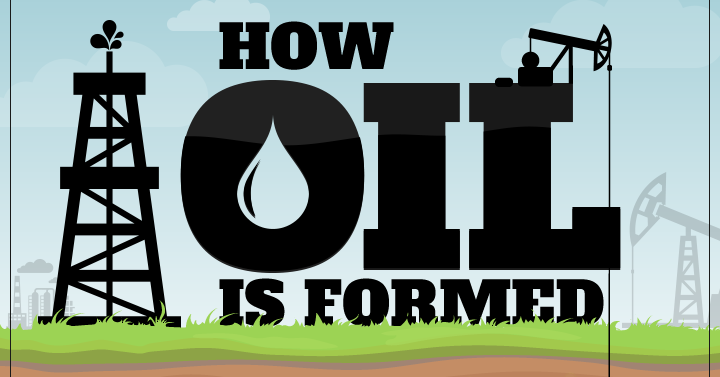
This infographic shows how oil is formed, along with some history, uses, and types of oil found. It also presents a lesser-known theory on how oil...
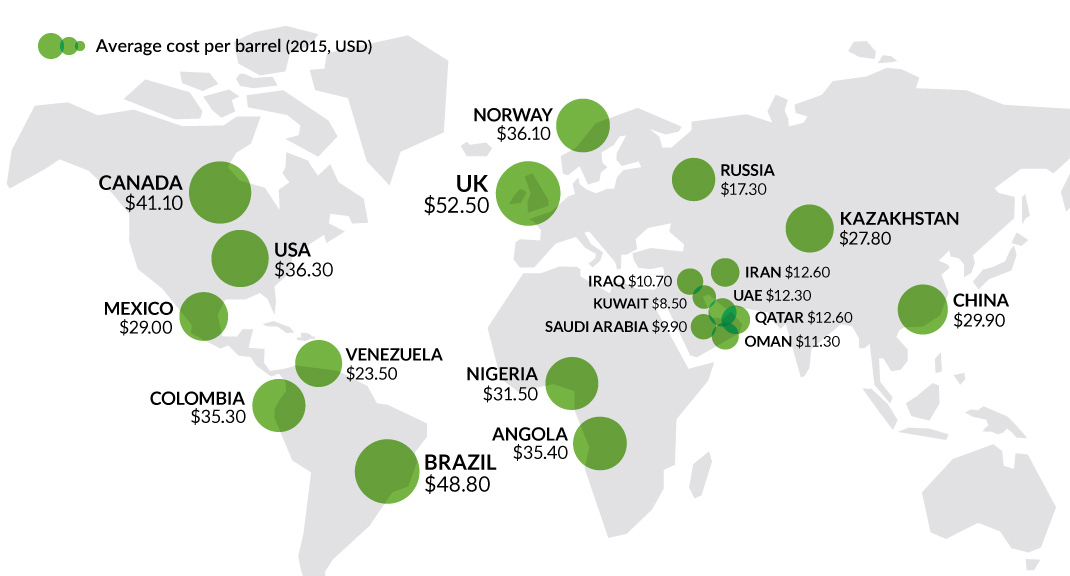
It's been two years since the oil price crash. This chart looks at three sets of oil data, while we check in on the economies most...
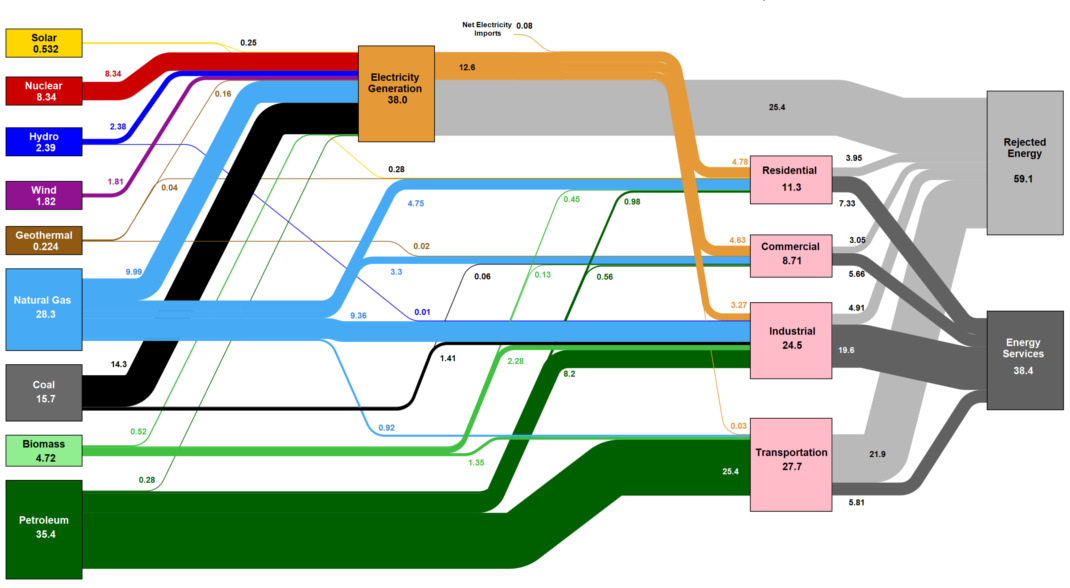
This massive diagram shows all energy created in the U.S., and where it goes. It's not sexy, but it gives a great 10,000 ft overview of...


