Report Card: Grading U.S. Infrastructure
Part One: Why U.S. Infrastructure Needed Investment
U.S. infrastructure has been a significant topic of conversation over the past few years, with the 117th Congress looking to repair and improve much of the nation’s ailing backbone.
For this three-part Rejuvenating U.S. Infrastructure series, we partnered with Global X ETFs to explore what prompted the U.S. to spend heavily on infrastructure, the corrections they made, and the investments in American innovation through bills such as the Bipartisan Infrastructure Law and the Inflation Reduction Act.
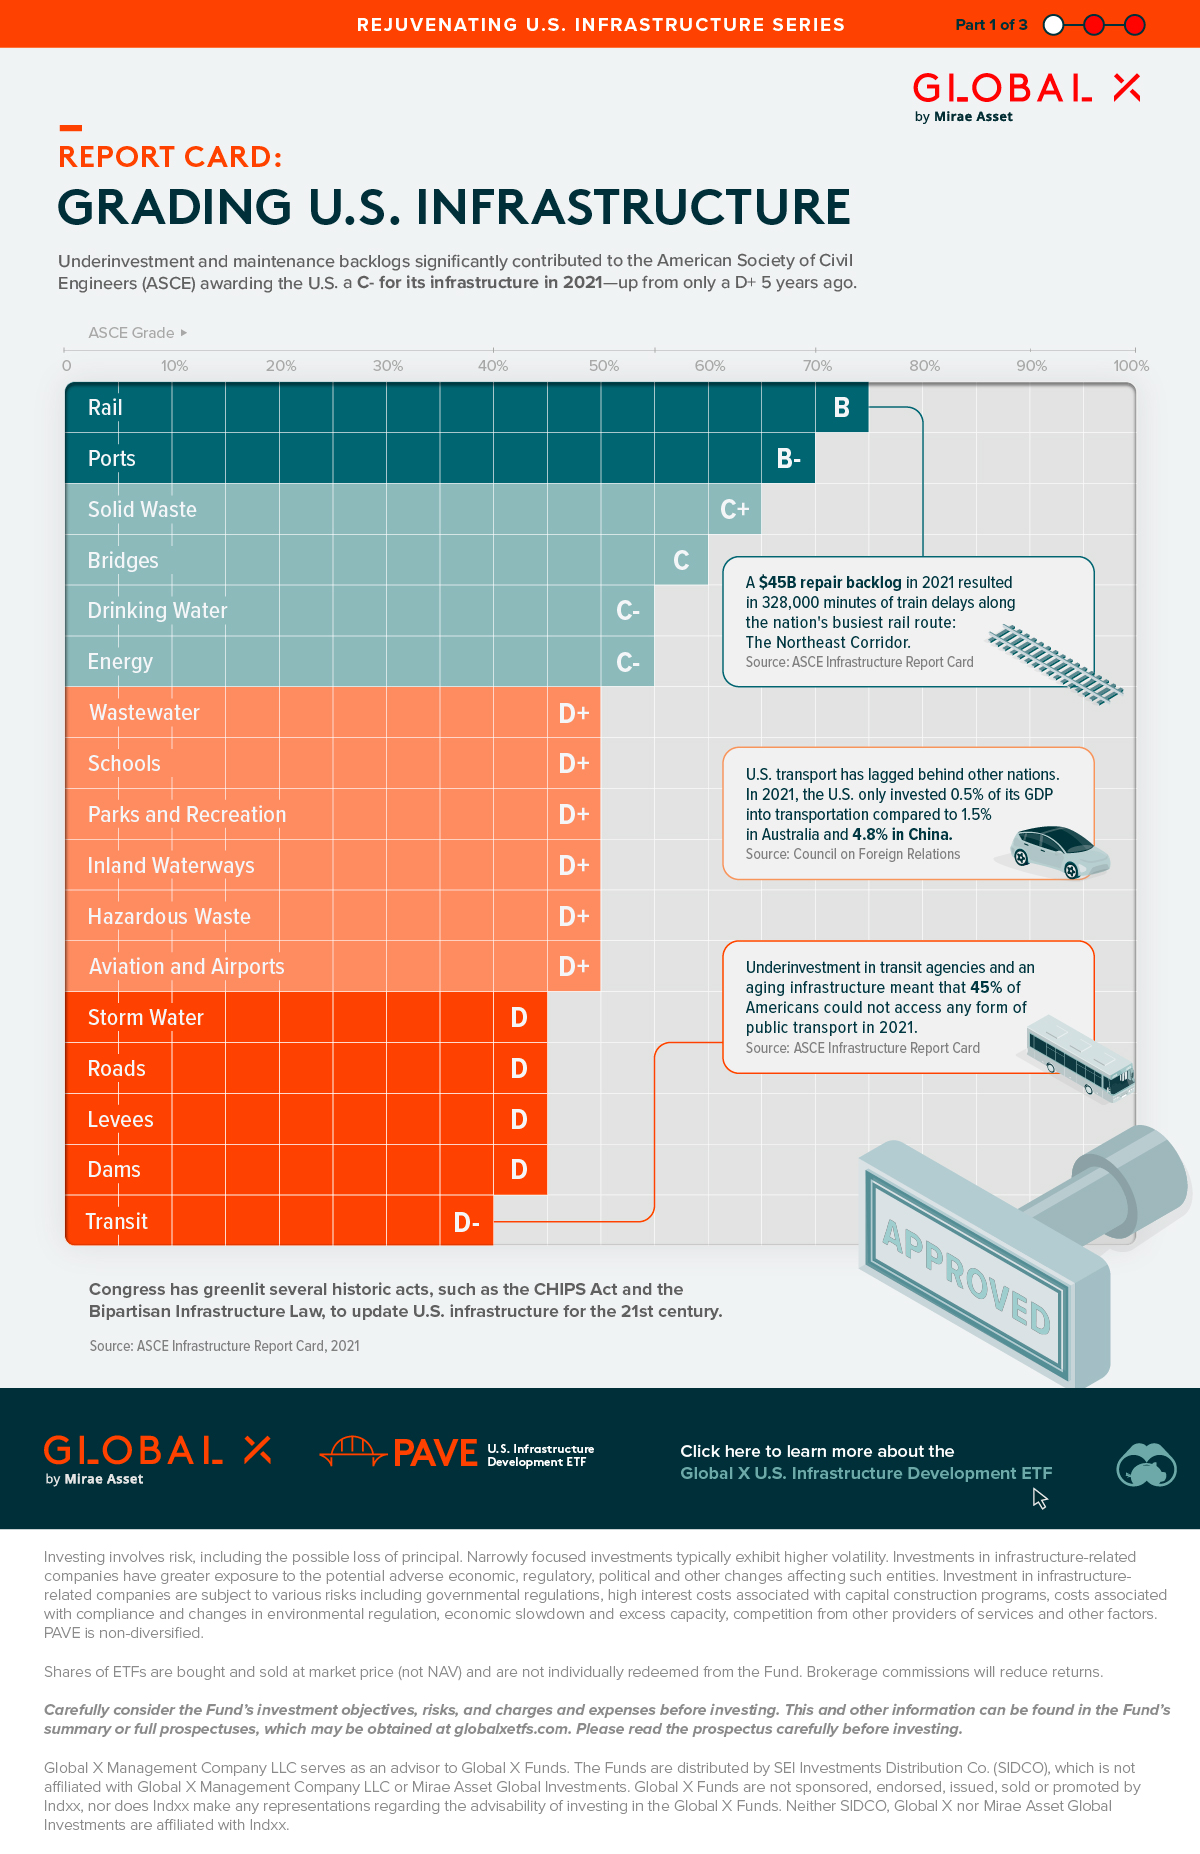
But first, in part one, let’s find out what led the American Society of Civil Engineers (ASCE) to report that, without action, the poor state of the nation’s infrastructure could cost the country a staggering $10 trillion in lost GDP by 2039.
U.S. Infrastructure Woes
| Infrastructure Area | Letter Grade |
|---|---|
| Aviation and Airports | D+ |
| Bridges | C |
| Dams | D |
| Drinking Water | C- |
| Energy | C- |
| Hazardous Waste | D+ |
| Inland Waterways | D+ |
| Levees | D |
| Parks and Recreation | D+ |
| Ports | B- |
| Rail | B |
| Roads | D |
| Schools | D+ |
| Solid Waste | C+ |
| Storm Water | D |
| Transit | D- |
| Wastewater | D+ |
Source of the Problem
Simply put, U.S. infrastructure was old and needed investment and modernization. A great example is that, in 2021, the nation’s busiest train route, the Northeast Corridor, had a $45 billion repair backlog that caused nearly 230 days’ worth of train delays.
Another contributing factor was public access. In 2021, slow system growth left 45% of Americans needing access to public transit.
Investing in a Solution
In 2021, the U.S. invested only 0.5% of its GDP in infrastructure, whereas Australia invested 1.5% and China invested 4.8% in the same year. So, it was clear that further investment was the solution.
In the second part of this series, we explore how the U.S. has allocated $1.2 trillion for its infrastructure in the last few years, while in the third, we explore how infrastructure investment is accelerating the U.S. clean energy transition.
The U.S. Congress has approved several critical pieces of legislation, including the CHIPS Act and the Bipartisan Infrastructure Law, aimed at modernizing its infrastructure to meet the demands of the 21st century, and you can join them by investing in American innovation.

Click here to learn more about the Global X U.S. Infrastructure Development ETF.

-

 Economy3 days ago
Economic Growth Forecasts for G7 and BRICS Countries in 2024
The IMF has released its economic growth forecasts for 2024. How do the G7 and BRICS countries compare?
-

 United States2 weeks ago
Ranked: The Largest U.S. Corporations by Number of Employees
We visualized the top U.S. companies by employees, revealing the massive scale of retailers like Walmart, Target, and Home Depot.
-

 Economy2 weeks ago
Where U.S. Inflation Hit the Hardest in March 2024
We visualized product categories that saw the highest % increase in price due to U.S. inflation as of March 2024.
-

 Economy1 month ago
G20 Inflation Rates: Feb 2024 vs COVID Peak
We visualize inflation rates across G20 countries as of Feb 2024, in the context of their COVID-19 pandemic peak.
-

 Economy1 month ago
Mapped: Unemployment Claims by State
This visual heatmap of unemployment claims by state highlights New York, California, and Alaska leading the country by a wide margin.
-

 Economy2 months ago
Confidence in the Global Economy, by Country
Will the global economy be stronger in 2024 than in 2023?


