Mapped: U.S. Investment in Sustainable Infrastructure (2021-2023)


Part Three: Mapping U.S. Investment in Sustainable Infrastructure (2021-2023)
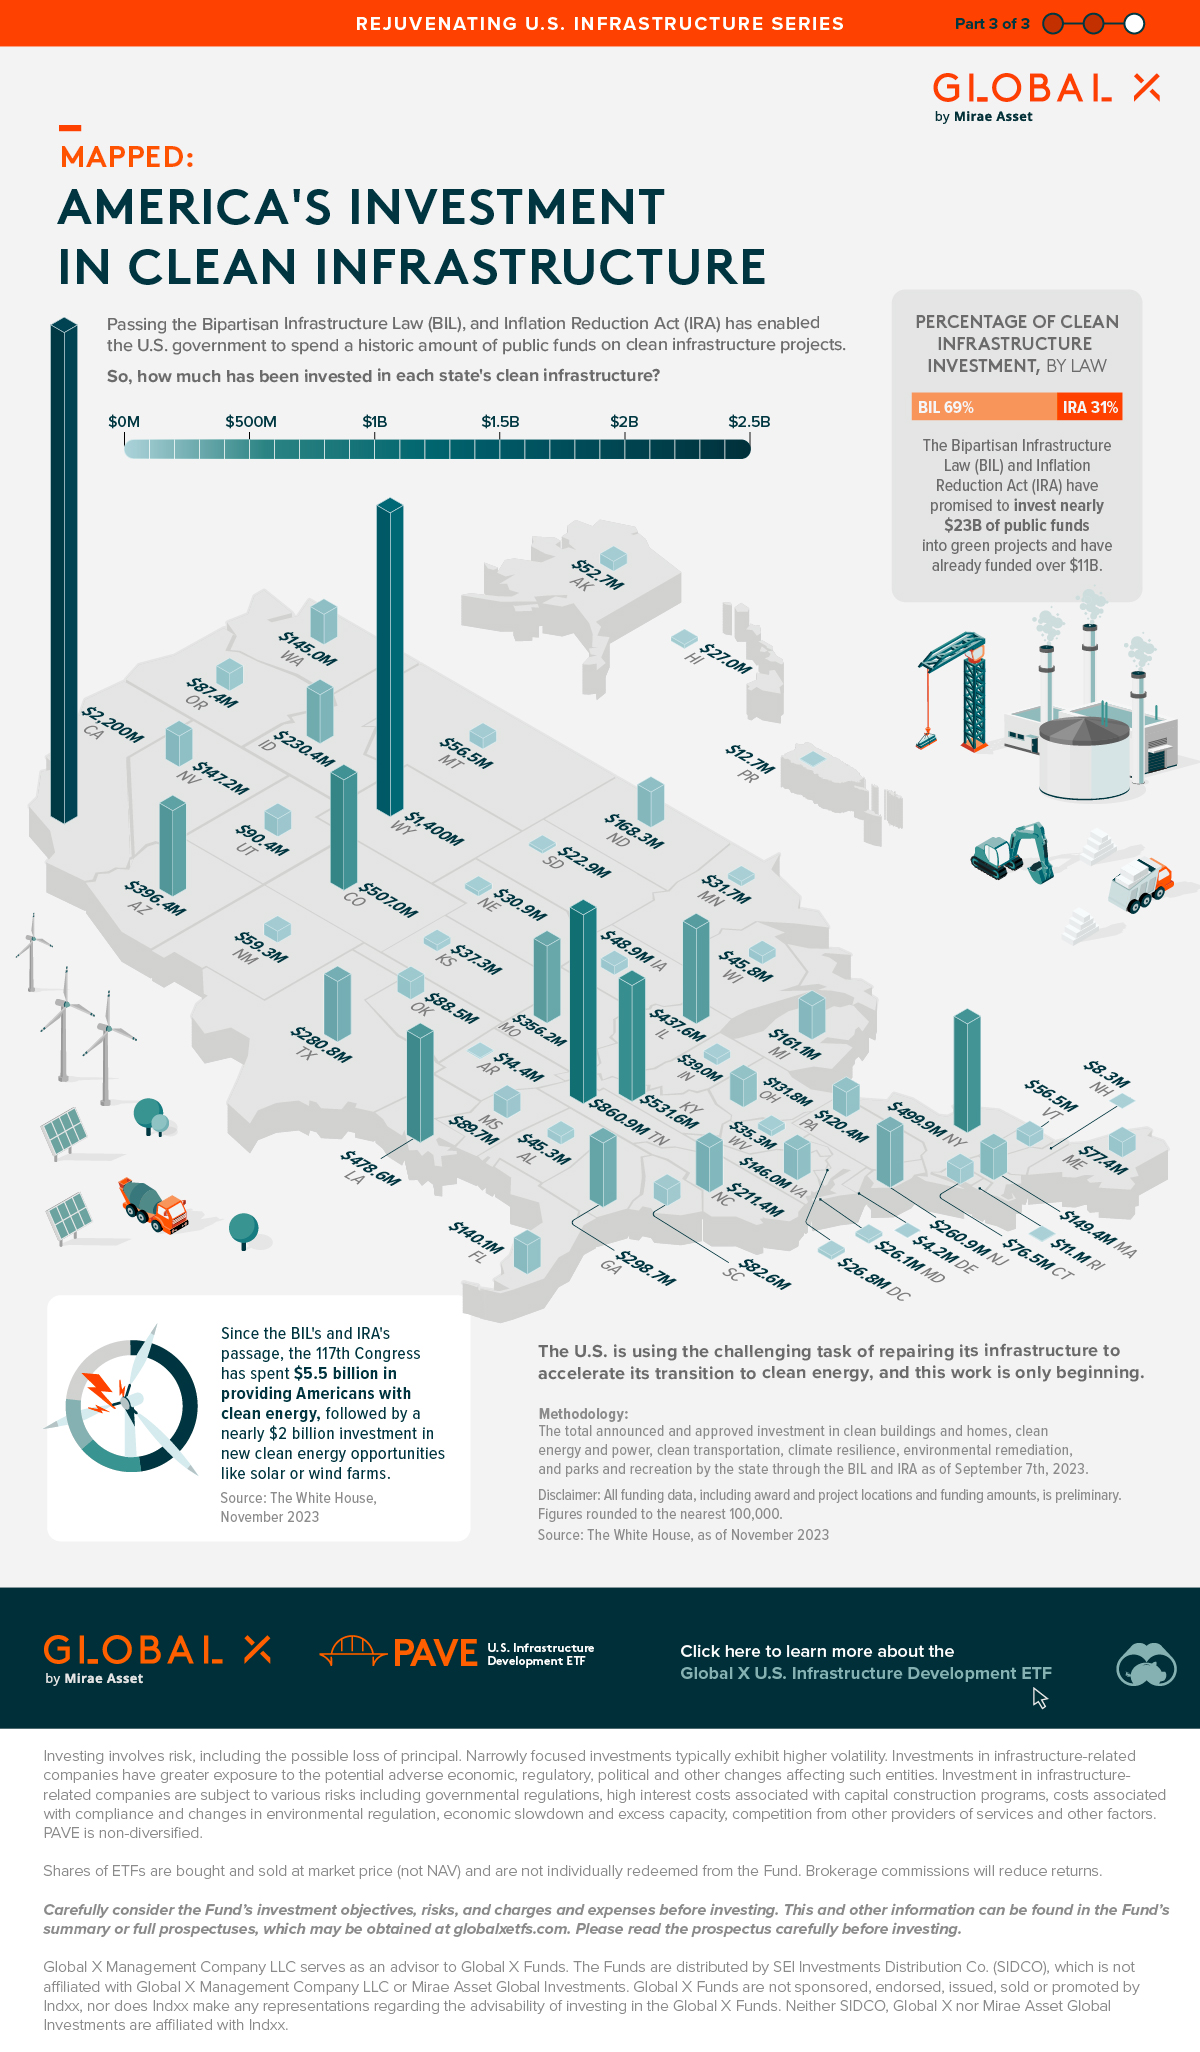
The U.S. is using its infrastructure renovation as an opportunity to invest heavily in sustainable infrastructure and accelerate its transition to clean energy.
Through the Bipartisan Infrastructure Law (BIL) and Inflation Reduction Act (IRA), the 117th Congress spent a historic amount of public funds on sustainable infrastructure projects.
So, for the final graphic in the Rejuavating U.S. Infrastructure series, we partnered with Global X ETFs to determine the amount invested in each state’s clean infrastructure so far.
Sustainable Infrastructure Investments Through the BIL and IRA
Sustainable infrastructure investment represents the total federal investment in various types of clean infrastructure. This includes clean buildings and homes, clean energy and power, clean transportation, climate resilience, environmental remediation, and parks and recreation.
This investment funds various activities, such as transforming an open field into a wind farm or providing cities with a fleet of new EV buses.
So, since passing the BIL and IRA in 2022, over $11.5 billion has been spent or allocated (as of November 2023) for clean energy and infrastructure. The breakdown of funds is as follows: 69% of the total comes from BIL, and 31% from the IRA.
Here is how funds have been divided by state so far:
| State | Investment | |||
|---|---|---|---|---|
| Alabama | $45,300,000 | |||
| Alaska | $52,700,000 | |||
| Arizona | $396,400,000 | |||
| Arkansas | $14,400,000 | |||
| California | $2,226,800,000 | |||
| Colorado | $507,000,000 | |||
| Connecticut | $76,500,000 | |||
| Delaware | $4,200,000 | |||
| District of Columbia | $26,800,000 | |||
| Florida | $140,100,000 | |||
| Georgia | $298,700,000 | |||
| Hawaii | $27,000,000 | |||
| Idaho | $230,400,000 | |||
| Illinois | $437,600,000 | |||
| Indiana | $39,000,000 | |||
| Iowa | $48,900,000 | |||
| Kansas | $37,300,000 | |||
| Kentucky | $531,600,000 | |||
| Louisiana | $478,600,000 | |||
| Maine | $77,400,000 | |||
| Maryland | $26,100,000 | |||
| Massachusetts | $149,400,000 | |||
| Michigan | $161,100,000 | |||
| Minnesota | $31,700,000 | |||
| Mississippi | $89,700,000 | |||
| Missouri | $356,200,000 | |||
| Montana | $56,500,000 | |||
| Nebraska | $30,900,000 | |||
| Nevada | $147,200,000 | |||
| New Hampshire | $8,300,000 | |||
| New Jersey | $260,900,000 | |||
| New Mexico | $59,300,000 | |||
| New York | $499,900,000 | |||
| North Carolina | $211,400,000 | |||
| North Dakota | $168,300,000 | |||
| Ohio | $131,800,000 | |||
| Oklahoma | $88,500,000 | |||
| Oregon | $87,400,000 | |||
| Pennsylvania | $120,400,000 | |||
| Puerto Rico | $12,700,000 | |||
| Rhode Island | $11,900,000 | |||
| South Carolina | $82,600,000 | |||
| South Dakota | $22,900,000 | |||
| Tennessee | $860,900,000 | |||
| Texas | $280,800,000 | |||
| Utah | $90,400,000 | |||
| Vermont | $56,500,000 | |||
| Virginia | $146,000,000 | |||
| Washington | $145,000,000 | |||
| West Virginia | $35,300,000 | |||
| Wisconsin | $45,800,000 | |||
| Wyoming | $1,379,900,000 |
Clean power has received the most investment, at 48%, followed by investments in new clean energy opportunities like solar or wind farms, at 16%.
Then, environmental remediation efforts like cleaning up oil spills or soil repair programs, sit at 13% of the total.
A Sustainable Future
Congress has already invested $11.5 billion in sustainable and clean infrastructure. But this is only half of the $23 billion the BIL and IRA have promised to provide over the next few years.
The promise of future investment is an excellent opportunity for the U.S. to accelerate its clean energy transition and rejuvenate its infrastructure.
This is the final part in the Rejuevenating U.S. Infrastructure series; be sure to to read parts one and two to learn why U.S. infrastructure required investment in the first place, and how much has been spent so far.
Click here to learn more about the Global X U.S. Infrastructure Development ETF.

-

 Green19 hours ago
The Carbon Footprint of Major Travel Methods
Going on a cruise ship and flying domestically are the most carbon-intensive travel methods.
-

 Green2 weeks ago
Ranking the Top 15 Countries by Carbon Tax Revenue
This graphic highlights France and Canada as the global leaders when it comes to generating carbon tax revenue.
-

 Green2 weeks ago
Ranked: The Countries With the Most Air Pollution in 2023
South Asian nations are the global hotspot for pollution. In this graphic, we rank the world’s most polluted countries according to IQAir.
-

 Green2 weeks ago
Top Countries By Forest Growth Since 2001
One country is taking reforestation very seriously, registering more than 400,000 square km of forest growth in two decades.
-

 Green3 weeks ago
Ranked: Top Countries by Total Forest Loss Since 2001
The country with the most forest loss since 2001 lost as much forest cover as the next four countries combined.
-

 Agriculture2 months ago
The World’s Top Cocoa Producing Countries
Here are the largest cocoa producing countries globally—from Côte d’Ivoire to Brazil—as cocoa prices hit record highs.