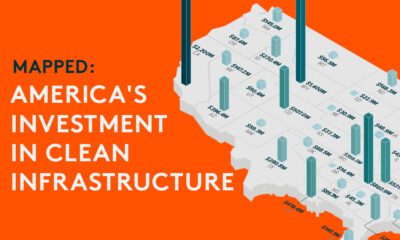

This graphic shows high levels of investment in U.S. clean infrastructure between 2021 and 2023.
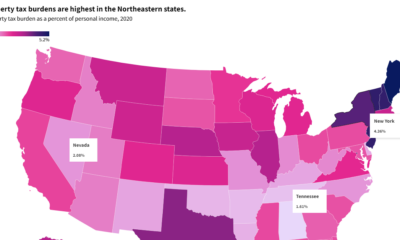

This interactive graphic shows property taxes by state in the U.S. as a percentage of personal income in 2020.
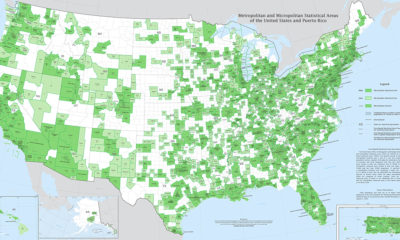

Fitting a complex population center into a tidy statistical box is no easy feat. Thankfully, this U.S. Census Bureau map is up to the challenge.


 Creator Program