Misc
The Science of Making Things Go Viral
In today’s marketing landscape, the barrier to entry for creating and publishing new content is at an all-time low.
That means social networks and other distribution channels are flooded with content – and so naturally, as a way of filtering and screening our feeds, we gravitate to the content that everyone else is sharing.
These widely-shared articles, infographics, and videos tend to pique our curiosity, or they hit us with powerful “a-ha” moments. After all, these things are going viral for a reason.
Making Things Go Viral
Whether you are a marketer or an occasional writer, it’s worth knowing how this coveted viral effect comes about.
Today’s infographic comes from Outgrow, and it covers two psychological theories on what leads to viral content, why we share certain things, and some examples of winning viral campaigns that took advantage of triggering these emotions.
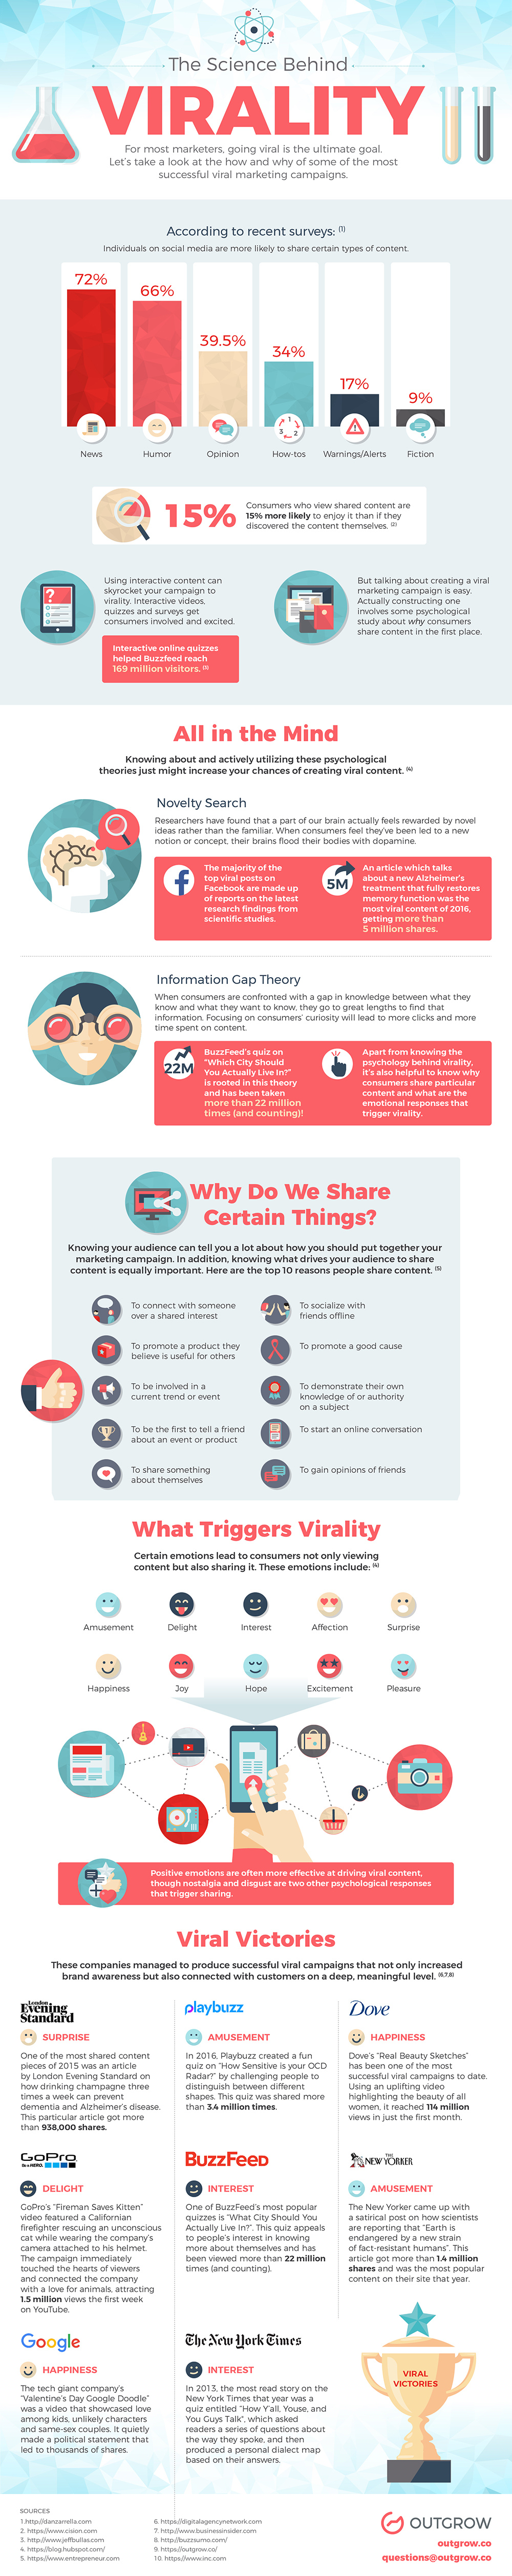
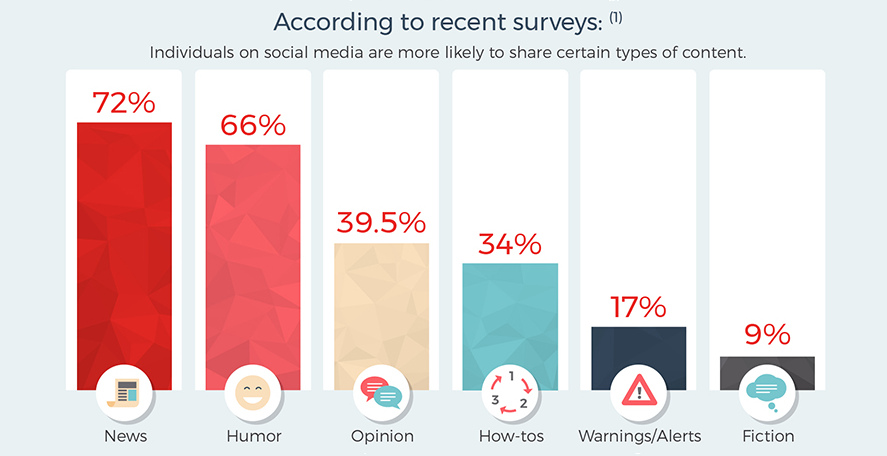
People share individual pieces of content for all types of reasons, but there are some commonalities.
According to psychological theory, content that feels novel or that fills information gaps may trigger the release of dopamine in the brain. Further, content that touches the right emotions (excitement, surprise, nostalgia, etc.) can also latch onto a viral effect.
Virality and The Brain
What role does psychology play in making things go viral?
Here are two well-documented psychological effects that trigger the reward pathways in the brain.
1. Novelty Seeking
Your mind is tired of seeing the same old ideas over and over again. That’s why things that are new or unusual will catch your eye – and this includes the content on your favorite website or social feed.
In fact, the brain is hardwired to search for novelty in this way. Seeing something new can motivate us to explore our environment for rewards, and with social media that reward is just a click away.
2. Information Gap Theory
Humans are obsessed with information and have an unquenchable interest in the world around them. That’s why, when your Facebook feed provides a chance to temporarily satisfy your curiosity with just one click, you can’t help but succumb.
Scientists haven’t figured out exactly how curiosity works yet, but what we do know so far is that it’s an itch that humans feel they must continually satisfy. More specifically, according to George Loewenstein’s information gap theory, we often act to fill a gap between what we know, and what we want to know.
Sharing is Caring
But even if something catches our attention, it still needs to spread far and wide to have a viral impact. That’s why the reasons we share content are important, and why posts typically hit on certain emotions to achieve virality.
People share content to:
- Connect with someone over a shared interest
- Promote a product they believe is useful to others
- Be involved in a current trend or event
- Be the first to tell a friend about a trend or event
- Share something about themselves
- Socialize with friends offline
- Promote a good cause
- Demonstrate their own knowledge or ability
- Start an online conversation
- Boost their reputation among friends
Lastly, specific positive emotions lead people to sharing content, including those of amusement, affection, surprise, happiness, and excitement. On the flipside, nostalgia and disgust are two other psychological responses that trigger sharing as well.


VC+
VC+: Get Our Key Takeaways From the IMF’s World Economic Outlook
A sneak preview of the exclusive VC+ Special Dispatch—your shortcut to understanding IMF’s World Economic Outlook report.

Have you read IMF’s latest World Economic Outlook yet? At a daunting 202 pages, we don’t blame you if it’s still on your to-do list.
But don’t worry, you don’t need to read the whole April release, because we’ve already done the hard work for you.
To save you time and effort, the Visual Capitalist team has compiled a visual analysis of everything you need to know from the report—and our VC+ Special Dispatch is available exclusively to VC+ members. All you need to do is log into the VC+ Archive.
If you’re not already subscribed to VC+, make sure you sign up now to access the full analysis of the IMF report, and more (we release similar deep dives every week).
For now, here’s what VC+ members get to see.
Your Shortcut to Understanding IMF’s World Economic Outlook
With long and short-term growth prospects declining for many countries around the world, this Special Dispatch offers a visual analysis of the key figures and takeaways from the IMF’s report including:
- The global decline in economic growth forecasts
- Real GDP growth and inflation forecasts for major nations in 2024
- When interest rate cuts will happen and interest rate forecasts
- How debt-to-GDP ratios have changed since 2000
- And much more!

Get the Full Breakdown in the Next VC+ Special Dispatch
VC+ members can access the full Special Dispatch by logging into the VC+ Archive, where you can also check out previous releases.
Make sure you join VC+ now to see exclusive charts and the full analysis of key takeaways from IMF’s World Economic Outlook.
Don’t miss out. Become a VC+ member today.
What You Get When You Become a VC+ Member
VC+ is Visual Capitalist’s premium subscription. As a member, you’ll get the following:
- Special Dispatches: Deep dive visual briefings on crucial reports and global trends
- Markets This Month: A snappy summary of the state of the markets and what to look out for
- The Trendline: Weekly curation of the best visualizations from across the globe
- Global Forecast Series: Our flagship annual report that covers everything you need to know related to the economy, markets, geopolitics, and the latest tech trends
- VC+ Archive: Hundreds of previously released VC+ briefings and reports that you’ve been missing out on, all in one dedicated hub
You can get all of the above, and more, by joining VC+ today.

-

 Mining1 week ago
Gold vs. S&P 500: Which Has Grown More Over Five Years?
-

 Markets2 weeks ago
Ranked: The Most Valuable Housing Markets in America
-

 Money2 weeks ago
Which States Have the Highest Minimum Wage in America?
-

 AI2 weeks ago
Ranked: Semiconductor Companies by Industry Revenue Share
-

 Markets2 weeks ago
Ranked: The World’s Top Flight Routes, by Revenue
-

 Countries2 weeks ago
Population Projections: The World’s 6 Largest Countries in 2075
-

 Markets2 weeks ago
The Top 10 States by Real GDP Growth in 2023
-

 Demographics2 weeks ago
The Smallest Gender Wage Gaps in OECD Countries