Misc
Map: The Top Tourist Attraction in Every Country
View a high resolution version of this graphic
Map: The Top Tourist Attraction in Every Country
View the high resolution version of today’s graphic by clicking here.
Even as early as a decade ago, if you were backpacking in a foreign place, it was not uncommon to rely on the wisdom printed in travel guides such as Lonely Planet or Rick Steves to choose your day-to-day activities.
“Go off the beaten path to see this secluded black sand beach that’s only used by locals.”
“See this historic city tour, because it’s a hidden treasure that you won’t find in any other guidebook.”
Tips like these felt like secrets only privy to you and other smart readers – and while you were sitting on that hidden black sand beach, you could revel in the fact that the rest of the travelling masses were stuck in a two-hour line to get into some silly tourist trap.
For better or worse, things are now very different.
The Crowdsourced Era
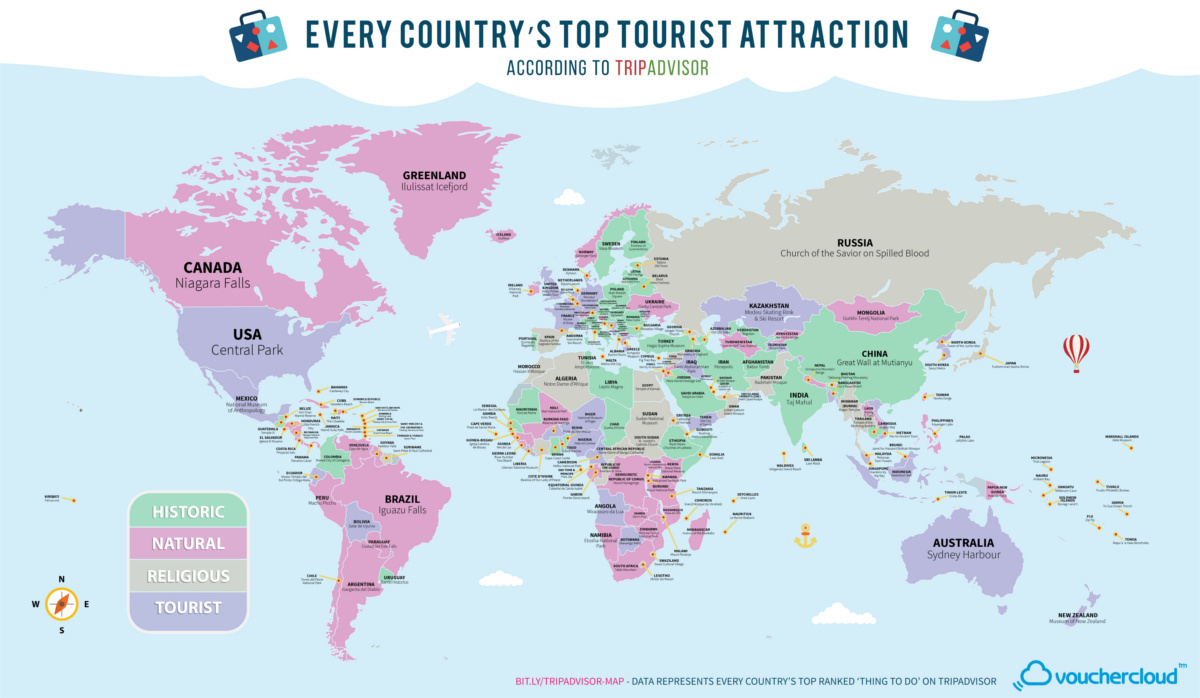
Today’s infographic comes to us from Vouchercloud, and it shows the top rated “Thing to Do” for every single country in the world, according to Tripadvisor reviews.
In other words, the list is based on the amalgamation of millions of reviews from fellow travelers that have experienced these sights or activities first-hand.
On the upside, these reviews are coming from your peers. People just like you have rated all of the attractions in an area – from tourist trap to hidden gem – and the end result is pretty fair and democratic.
But this democratic component also has a downside. In the United Kingdom, for example, the highest rated activity is not seeing Big Ben, Ancient Roman baths, Stonehenge, or the Churchill War Rooms – it’s the Harry Potter Studio Tour, with 32,000+ reviews and 83% of reviewers giving it a perfect 5-star rating.
While the Harry Potter tour is obviously a popular attraction, it’s not likely representative of the type of attractions that old school travel critics may have raved about in their travel books.
Top Things to Do
In the map, the top tourist destinations are broken down based on the type of attraction.
Here’s the mix of top destinations for the 197 countries and jurisdictions included in the analysis:
| Type of attraction | # of countries | % of countries |
|---|---|---|
| Natural | 76 | 38.6% |
| Historic | 54 | 27.4% |
| Tourist | 38 | 19.3% |
| Religious | 29 | 14.7% |
The top category of attraction is natural (38.6%), which includes places like Canada’s Niagara Falls or Norway’s Geiranger Fjord. Meanwhile, historic attractions like China’s Great Wall made up 27.4% of the total, and places of religious significance such as Thailand’s Temple of the Reclining Buddha were the top tourist attraction for 14.7% of the countries.
The remaining category, called “Tourist” includes a much wider variety of destinations within it.
These attractions range from Central Park in the New York City to the aforementioned Harry Potter Studio Tours in the United Kingdom. The wide category also includes museums like France’s Musee d’Orsay, which holds a staggering collection of impressionist art, as well as Germany’s Miniatur Wunderland, which is a massive miniature railroad in Hamburg.


VC+
VC+: Get Our Key Takeaways From the IMF’s World Economic Outlook
A sneak preview of the exclusive VC+ Special Dispatch—your shortcut to understanding IMF’s World Economic Outlook report.

Have you read IMF’s latest World Economic Outlook yet? At a daunting 202 pages, we don’t blame you if it’s still on your to-do list.
But don’t worry, you don’t need to read the whole April release, because we’ve already done the hard work for you.
To save you time and effort, the Visual Capitalist team has compiled a visual analysis of everything you need to know from the report—and our upcoming VC+ Special Dispatch will be available exclusively to VC+ members on Thursday, April 25th.
If you’re not already subscribed to VC+, make sure you sign up now to receive the full analysis of the IMF report, and more (we release similar deep dives every week).
For now, here’s what VC+ members can expect to receive.
Your Shortcut to Understanding IMF’s World Economic Outlook
With long and short-term growth prospects declining for many countries around the world, this Special Dispatch offers a visual analysis of the key figures and takeaways from the IMF’s report including:
- The global decline in economic growth forecasts
- Real GDP growth and inflation forecasts for major nations in 2024
- When interest rate cuts will happen and interest rate forecasts
- How debt-to-GDP ratios have changed since 2000
- And much more!

Get the Full Breakdown in the Next VC+ Special Dispatch
VC+ members will receive the full Special Dispatch on Thursday, April 25th.
Make sure you join VC+ now to receive exclusive charts and the full analysis of key takeaways from IMF’s World Economic Outlook.
Don’t miss out. Become a VC+ member today.
What You Get When You Become a VC+ Member
VC+ is Visual Capitalist’s premium subscription. As a member, you’ll get the following:
- Special Dispatches: Deep dive visual briefings on crucial reports and global trends
- Markets This Month: A snappy summary of the state of the markets and what to look out for
- The Trendline: Weekly curation of the best visualizations from across the globe
- Global Forecast Series: Our flagship annual report that covers everything you need to know related to the economy, markets, geopolitics, and the latest tech trends
- VC+ Archive: Hundreds of previously released VC+ briefings and reports that you’ve been missing out on, all in one dedicated hub
You can get all of the above, and more, by joining VC+ today.

-

 Green1 week ago
Ranked: The Countries With the Most Air Pollution in 2023
-

 Automotive2 weeks ago
Almost Every EV Stock is Down After Q1 2024
-

 AI2 weeks ago
The Stock Performance of U.S. Chipmakers So Far in 2024
-

 Markets2 weeks ago
Charted: Big Four Market Share by S&P 500 Audits
-

 Real Estate2 weeks ago
Ranked: The Most Valuable Housing Markets in America
-

 Money2 weeks ago
Which States Have the Highest Minimum Wage in America?
-

 AI2 weeks ago
Ranked: Semiconductor Companies by Industry Revenue Share
-

 Travel2 weeks ago
Ranked: The World’s Top Flight Routes, by Revenue