Money
Charting the Relationship Between Wealth and Happiness, by Country
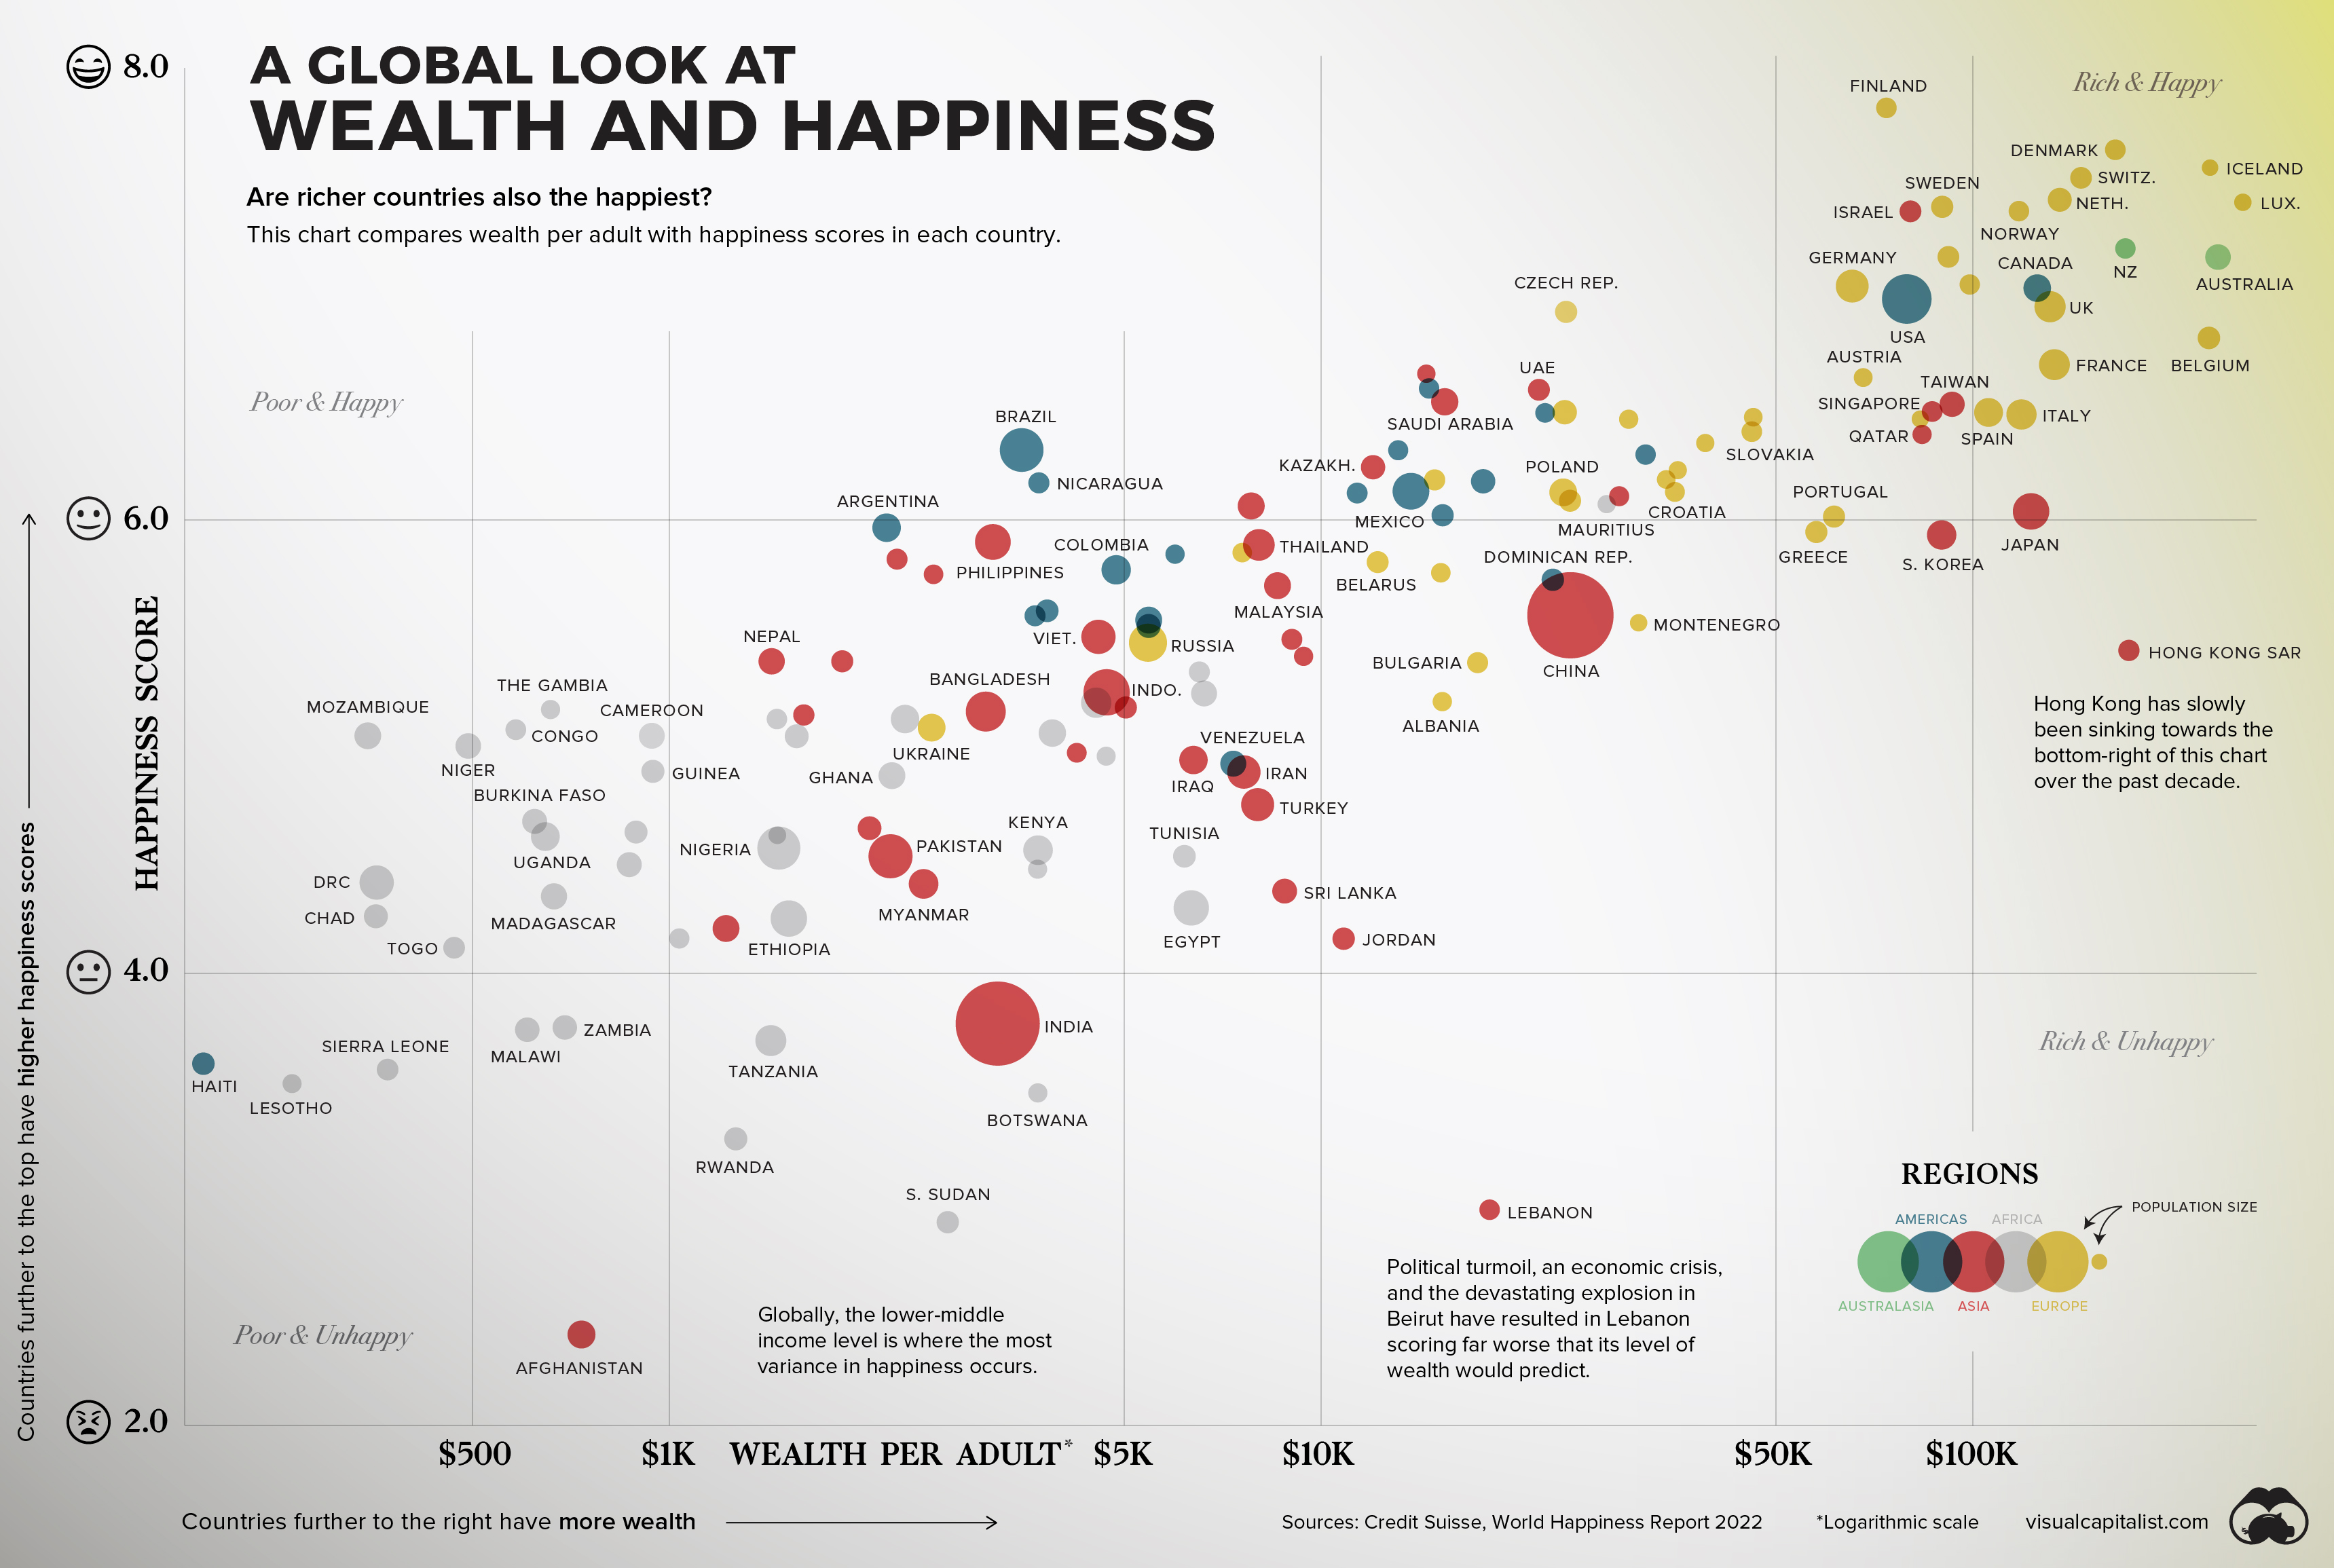


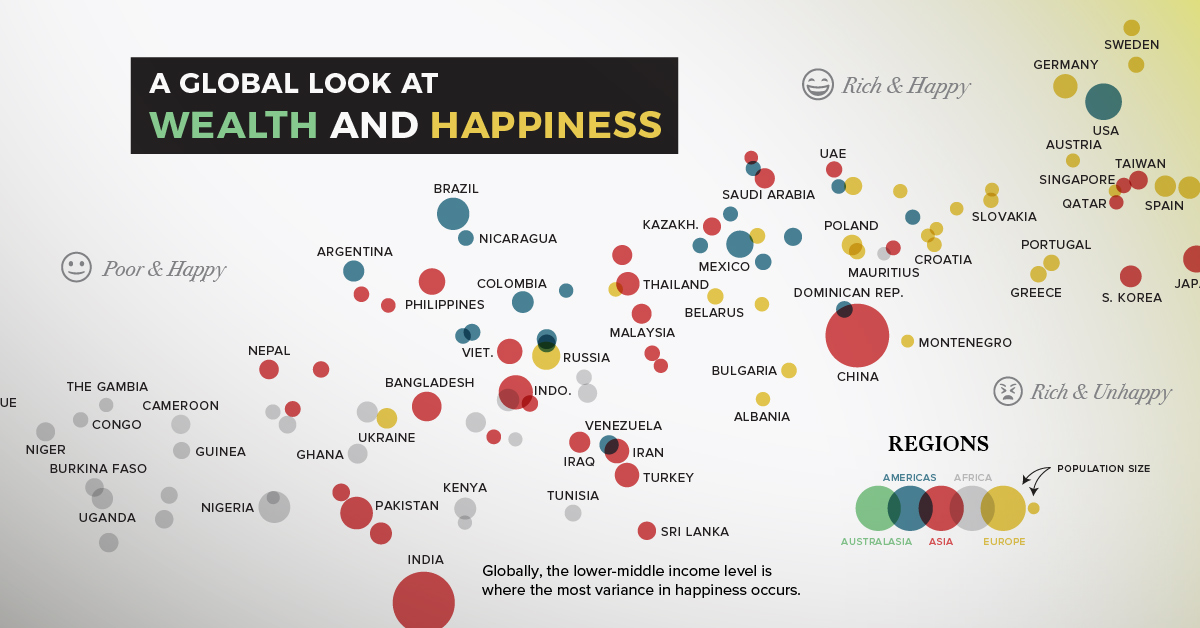
The Relationship Between Wealth and Happiness, by Country
Throughout history, the pursuit of happiness has been a preoccupation of humankind.
Of course, we humans are not just content with measuring our own happiness, but also our happiness in relation to the people around us—and even other people around the world. The annual World Happiness Report, which uses global survey data to report how people evaluate their own lives in more than 150 countries, helps us do just that.
The factors that contribute to happiness are as subjective and specific as the billions of humans they influence, but there are a few that have continued to resonate over time. Family. Love. Purpose. Wealth. The first three examples are tough to measure, but the latter can be analyzed in a data-driven way.
Does money really buy happiness? Let’s find out.
Wealth and Happiness
To crunch the numbers, we looked at data from Credit Suisse, which breaks down the average wealth per adult in various countries around the world.
The table below looks at 146 countries by their happiness score and wealth per adult:
| Country | Median Wealth per Adult (US$) | Happiness Score |
|---|---|---|
| 🇫🇮 Finland | 73,775 | 7.8 |
| 🇩🇰 Denmark | 165,622 | 7.6 |
| 🇮🇸 Iceland | 231,462 | 7.6 |
| 🇨🇭 Switzerland | 146,733 | 7.5 |
| 🇮🇱 Israel | 80,315 | 7.4 |
| 🇸🇪 Sweden | 89,846 | 7.4 |
| 🇳🇴 Norway | 117,798 | 7.4 |
| 🇳🇱 Netherlands | 136,105 | 7.4 |
| 🇱🇺 Luxembourg | 259,899 | 7.4 |
| 🇦🇹 Austria | 91,833 | 7.2 |
| 🇳🇿 New Zealand | 171,624 | 7.2 |
| 🇦🇺 Australia | 238,072 | 7.2 |
| 🇩🇪 Germany | 65,374 | 7.0 |
| 🇺🇸 United States | 79,274 | 7.0 |
| 🇮🇪 Ireland | 99,028 | 7.0 |
| 🇨🇦 Canada | 125,688 | 7.0 |
| 🇨🇿 Czech Republic | 23,794 | 6.9 |
| 🇬🇧 United Kingdom | 131,522 | 6.9 |
| 🇧🇪 Belgium | 230,548 | 6.8 |
| 🇫🇷 France | 133,559 | 6.7 |
| 🇧🇭 Bahrain | 14,520 | 6.6 |
| 🇨🇷 Costa Rica | 14,662 | 6.6 |
| 🇦🇪 United Arab Emirates | 21,613 | 6.6 |
| 🇸🇮 Slovenia | 67,961 | 6.6 |
| 🇸🇦 Saudi Arabia | 15,495 | 6.5 |
| 🇺🇾 Uruguay | 22,088 | 6.5 |
| 🇷🇴 Romania | 23,675 | 6.5 |
| 🇽🇰 Kosovo | 46,087 | 6.5 |
| 🇸🇬 Singapore | 86,717 | 6.5 |
| 🇹🇼 Taiwan | 93,044 | 6.5 |
| 🇪🇸 Spain | 105,831 | 6.5 |
| 🇮🇹 Italy | 118,885 | 6.5 |
| 🇱🇹 Lithuania | 29,679 | 6.4 |
| 🇸🇰 Slovakia | 45,853 | 6.4 |
| 🇶🇦 Qatar | 83,680 | 6.4 |
| 🇲🇹 Malta | 84,390 | 6.4 |
| 🇧🇷 Brazil | 3,469 | 6.3 |
| 🇵🇦 Panama | 13,147 | 6.3 |
| 🇬🇹 Guatemala | 30,586 | 6.3 |
| 🇪🇪 Estonia | 38,901 | 6.3 |
| 🇳🇮 Nicaragua | 3,694 | 6.2 |
| 🇰🇿 Kazakhstan | 12,029 | 6.2 |
| 🇷🇸 Serbia | 14,954 | 6.2 |
| 🇨🇱 Chile | 17,747 | 6.2 |
| 🇱🇻 Latvia | 33,884 | 6.2 |
| 🇨🇾 Cyprus | 35,300 | 6.2 |
| 🇺🇿 Uzbekistan | 7,821 | 6.1 |
| 🇸🇻 El Salvador | 11,372 | 6.1 |
| 🇲🇽 Mexico | 13,752 | 6.1 |
| 🇵🇱 Poland | 23,550 | 6.1 |
| 🇭🇺 Hungary | 24,126 | 6.1 |
| 🇲🇺 Mauritius | 27,456 | 6.1 |
| 🇰🇼 Kuwait | 28,698 | 6.1 |
| 🇭🇷 Croatia | 34,945 | 6.1 |
| 🇦🇷 Argentina | 2,157 | 6.0 |
| 🇭🇳 Honduras | 15,380 | 6.0 |
| 🇵🇹 Portugal | 61,306 | 6.0 |
| 🇯🇵 Japan | 122,980 | 6.0 |
| 🇵🇭 Philippines | 3,155 | 5.9 |
| 🇯🇲 Jamaica | 5,976 | 5.9 |
| 🇲🇩 Moldova | 7,577 | 5.9 |
| 🇹🇭 Thailand | 8,036 | 5.9 |
| 🇬🇷 Greece | 57,595 | 5.9 |
| 🇰🇷 South Korea | 89,671 | 5.9 |
| 🇰🇬 Kyrgyzstan | 2,238 | 5.8 |
| 🇲🇳 Mongolia | 2,546 | 5.8 |
| 🇨🇴 Colombia | 4,854 | 5.8 |
| 🇧🇾 Belarus | 12,168 | 5.8 |
| 🇧🇦 Bosnia and Herzegovina | 15,283 | 5.8 |
| 🇲🇾 Malaysia | 8,583 | 5.7 |
| 🇩🇴 Dominican Republic | 22,701 | 5.7 |
| 🇵🇾 Paraguay | 3,644 | 5.6 |
| 🇧🇴 Bolivia | 3,804 | 5.6 |
| 🇵🇪 Peru | 5,445 | 5.6 |
| 🇨🇳 China | 24,067 | 5.6 |
| 🇻🇳 Vietnam | 4,559 | 5.5 |
| 🇷🇺 Russia | 5,431 | 5.5 |
| 🇪🇨 Ecuador | 5,444 | 5.5 |
| 🇹🇲 Turkmenistan | 9,030 | 5.5 |
| 🇲🇪 Montenegro | 30,739 | 5.5 |
| 🇳🇵 Nepal | 1,437 | 5.4 |
| 🇹🇯 Tajikistan | 1,844 | 5.4 |
| 🇦🇲 Armenia | 9,411 | 5.4 |
| 🇧🇬 Bulgaria | 17,403 | 5.4 |
| 🇭🇰 Hong Kong SAR | 173,768 | 5.4 |
| 🇱🇾 Libya | 6,512 | 5.3 |
| 🇧🇩 Bangladesh | 3,062 | 5.2 |
| 🇿🇦 South Africa | 4,523 | 5.2 |
| 🇮🇩 Indonesia | 4,693 | 5.2 |
| 🇦🇿 Azerbaijan | 5,022 | 5.2 |
| 🇨🇮 Côte d'Ivoire | 6,621 | 5.2 |
| 🇦🇱 Albania | 15,363 | 5.2 |
| 🇲🇰 North Macedonia | 51,788 | 5.2 |
| 🇬🇲 The Gambia | 658 | 5.2 |
| 🇱🇷 Liberia | 1,464 | 5.1 |
| 🇱🇦 Laos | 1,610 | 5.1 |
| 🇩🇿 Algeria | 2,302 | 5.1 |
| 🇺🇦 Ukraine | 2,529 | 5.1 |
| 🇲🇦 Morocco | 3,874 | 5.1 |
| 🇨🇬 Congo | 582 | 5.1 |
| 🇸🇳 Senegal | 1,570 | 5.0 |
| 🇬🇪 Georgia | 4,223 | 5.0 |
| 🇬🇦 Gabon | 4,685 | 5.0 |
| 🇲🇿 Mozambique | 345 | 5.0 |
| 🇳🇪 Niger | 492 | 5.0 |
| 🇨🇲 Cameroon | 941 | 5.0 |
| 🇬🇭 Ghana | 2,198 | 4.9 |
| 🇮🇶 Iraq | 6,378 | 4.9 |
| 🇻🇪 Venezuela | 7,341 | 4.9 |
| 🇮🇷 Iran | 7,621 | 4.9 |
| 🇬🇳 Guinea | 938 | 4.9 |
| 🇹🇷 Turkey | 8,001 | 4.7 |
| 🇧🇫 Burkina Faso | 622 | 4.7 |
| 🇰🇲 Comoros | 1,466 | 4.6 |
| 🇳🇬 Nigeria | 1,474 | 4.6 |
| 🇰🇭 Cambodia | 2,031 | 4.6 |
| 🇺🇬 Uganda | 646 | 4.6 |
| 🇧🇯 Benin | 890 | 4.6 |
| 🇵🇰 Pakistan | 2,187 | 4.5 |
| 🇳🇦 Namibia | 3,677 | 4.5 |
| 🇰🇪 Kenya | 3,683 | 4.5 |
| 🇹🇳 Tunisia | 6,177 | 4.5 |
| 🇲🇱 Mali | 869 | 4.5 |
| 🇲🇲 Myanmar | 2,458 | 4.4 |
| 🇱🇰 Sri Lanka | 8,802 | 4.4 |
| 🇨🇩 DR Congo | 356 | 4.4 |
| 🇪🇬 Egypt | 6,329 | 4.3 |
| 🇹🇩 Chad | 355 | 4.3 |
| 🇲🇬 Madagascar | 666 | 4.3 |
| 🇲🇷 Mauritania | 1,037 | 4.2 |
| 🇾🇪 Yemen | 1,223 | 4.2 |
| 🇪🇹 Ethiopia | 1,527 | 4.2 |
| 🇯🇴 Jordan | 10,842 | 4.2 |
| 🇹🇬 Togo | 468 | 4.1 |
| 🇮🇳 India | 3,194 | 3.8 |
| 🇲🇼 Malawi | 606 | 3.8 |
| 🇿🇲 Zambia | 692 | 3.8 |
| 🇹🇿 Tanzania | 1,433 | 3.7 |
| 🇭🇹 Haiti | 193 | 3.6 |
| 🇸🇱 Sierra Leone | 370 | 3.6 |
| 🇧🇼 Botswana | 3,680 | 3.5 |
| 🇱🇸 Lesotho | 264 | 3.5 |
| 🇷🇼 Rwanda | 1,266 | 3.3 |
| 🇱🇧 Lebanon | 18,159 | 3.0 |
| 🇸🇸 South Sudan | 2,677 | 2.9 |
| 🇦🇫 Afghanistan | 734 | 2.4 |
While the results don’t definitively point to wealth contributing to happiness, there is a strong correlation across the board. Broadly speaking, the world’s poorest countries have the lowest happiness scores, and the richest report being the most happy.
Regional and Country-Level Observations
While many of the countries follow an obvious trend (more wealth = more happiness), there are nuances and outliers worth exploring.
- In Latin America, people self-report more happiness than the trend between wealth and happiness would predict.
- On the flip side, many nations in the Middle East report slightly less happiness than levels of wealth would predict.
- Political turmoil, an economic crisis, and the devastating explosion in Beirut have resulted in Lebanon scoring far worse than would be expected. Over the past decade, the country’s score has fallen by nearly two full points.
- Hong Kong has seen its happiness score sink for years now. Inequality, protests, instability, and now COVID-19 outbreaks have placed the region in an unusual zone on the chart: rich and unhappy.
Examining Inequality and Happiness
We’ve looked at the relationship between wealth and happiness between countries, but what about within countries?
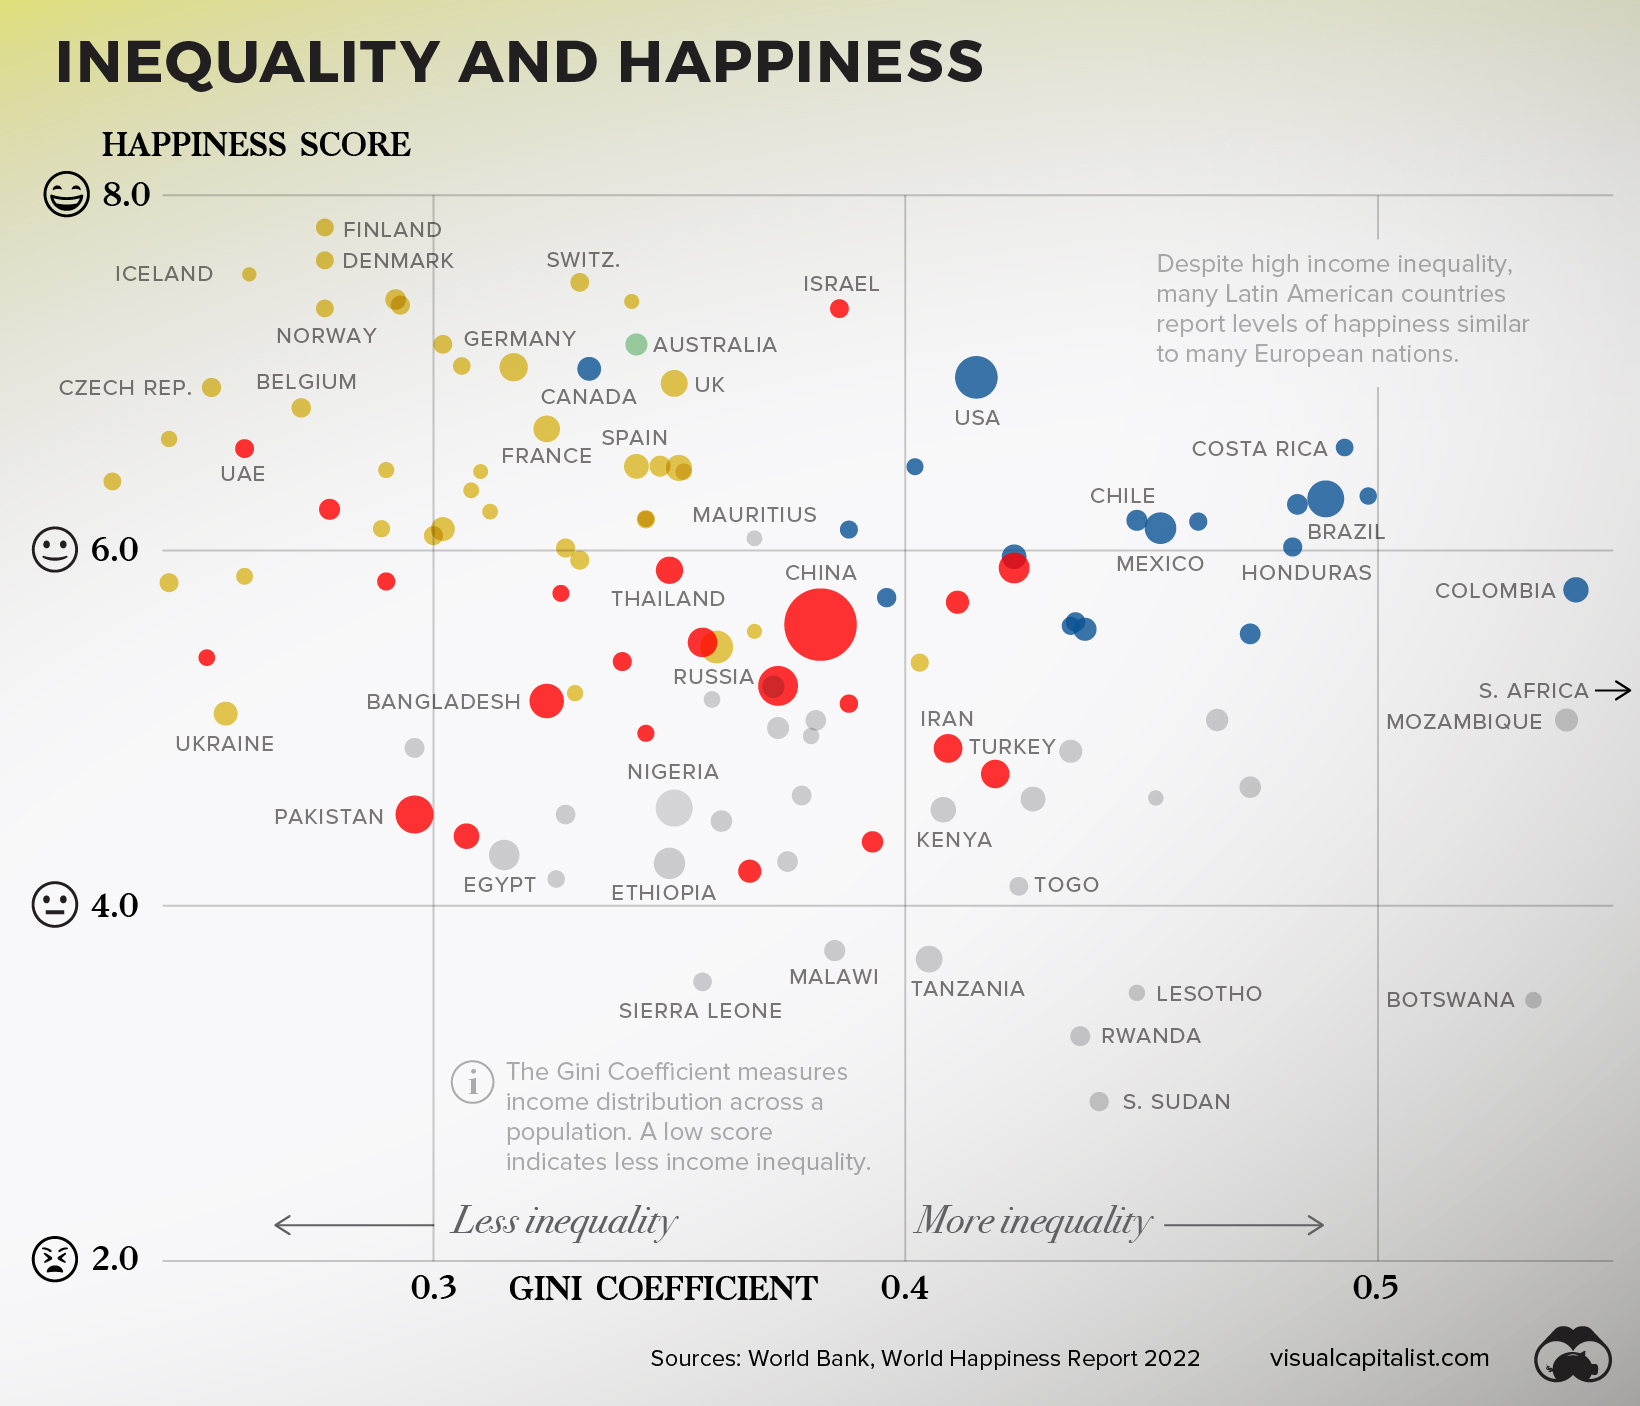
The Gini Coefficient is a tool that allows us to do just that. This measure looks at income distribution across a population, and applies a score to that population. Simply put, a score of 0 would be “perfect equality”, and 1 would be “perfect inequality” (i.e. an individual or group of recipients is receiving the entire income distribution).
Combined with the same happiness scale as before, this is how countries shape up.
While there is no ironclad conclusion that can be derived from this dataset, there are big picture observations worth highlighting.
The 15 Countries With Highest Income Inequality
| Countries with High inequality | Happiness Score | Gini Score |
|---|---|---|
| 🇿🇦 South Africa | 5.2 | 0.63 |
| 🇳🇦 Namibia | 4.5 | 0.59 |
| 🇿🇲 Zambia | 3.8 | 0.57 |
| 🇨🇴 Colombia | 5.8 | 0.54 |
| 🇲🇿 Mozambique | 5.0 | 0.54 |
| 🇧🇼 Botswana | 3.5 | 0.53 |
| 🇿🇼 Zimbabwe | 3.0 | 0.50 |
| 🇵🇦 Panama | 6.3 | 0.50 |
| 🇨🇷 Costa Rica | 6.6 | 0.49 |
| 🇧🇷 Brazil | 6.3 | 0.49 |
| 🇬🇹 Guatemala | 6.3 | 0.48 |
| 🇭🇳 Honduras | 6.0 | 0.48 |
| 🇧🇫 Burkina Faso | 4.7 | 0.47 |
| 🇪🇨 Ecuador | 5.5 | 0.47 |
| 🇨🇲 Cameroon | 5.0 | 0.47 |
| Average | 5.2 | 52 |
First, countries with lower income inequality tend to also report more happiness. The 15 countries in this dataset with the highest inequality (shown above) have an average happiness score 1.3 lower than the 15 countries with the lowest inequality (shown below).
The 15 Countries With Lowest Income Inequality
| Countries with low inequality | Happy Score | Gini Score |
|---|---|---|
| 🇸🇰 Slovakia | 6.4 | 23.2 |
| 🇧🇾 Belarus | 5.8 | 24.4 |
| 🇸🇮 Slovenia | 6.6 | 24.4 |
| 🇦🇲 Armenia | 5.4 | 25.2 |
| 🇨🇿 Czech Republic | 6.9 | 25.3 |
| 🇺🇦 Ukraine | 5.1 | 25.6 |
| 🇲🇩 Moldova | 5.9 | 26 |
| 🇦🇪 United Arab Emirates | 6.6 | 26 |
| 🇮🇸 Iceland | 7.6 | 26.1 |
| 🇧🇪 Belgium | 6.8 | 27.2 |
| 🇩🇰 Denmark | 7.6 | 27.7 |
| 🇫🇮 Finland | 7.8 | 27.7 |
| 🇳🇴 Norway | 7.4 | 27.7 |
| 🇰🇿 Kazakhstan | 6.2 | 27.8 |
| 🇭🇷 Croatia | 6.1 | 28.9 |
| Average | 6.5 | 26 |
Next, interesting regional differences emerge.
Despite high income inequality, many Latin American countries report levels of happiness similar to many much-wealthier European nations.
The Bottom Line
People have been seeking understanding on happiness for millennia now, and it’s unlikely that slicing and dicing datasets will crack the code. Still though, much like the pursuit of happiness, the pursuit of understanding is human nature.
And, in more concrete terms, the more policymakers and the public understand the link between wealth and happiness, the more likely we can shape societies that give us a better chance at living a happy life.
Where does this data come from?
Source: Credit Suisse Global Wealth Databook 2021, World Happiness Report 2022, World Bank
Data notes: This visualization includes countries that had available data for both happiness and wealth per adult. Credit Suisse notes that due to incomplete data, the following countries are estimates of average wealth per adult: North Macedonia, Kosovo, Guatemala, Dominican Republic, Honduras, Uzbekistan, Côte d’Ivoire, and South Sudan. Happiness data for countries is from the 2022 report, with the exception of: Qatar, DRC, Haiti, and South Sudan, which pull from the 2019 report. For Gini Coefficient calculations, only countries with data from 2014 onward were included. As a result, major economies such as India and Japan are excluded from that visualization.
Chart note: The wealth axis was plotted logarithmically to better show the trend visually. This approach is often used when a small number of results skew the visualization, making it harder to glean insight from. In this case, there are large extremes between the richest and poorest countries around the world.


Economy
Ranked: The Top 20 Countries in Debt to China
The 20 nations featured in this graphic each owe billions in debt to China, posing concerns for their economic future.
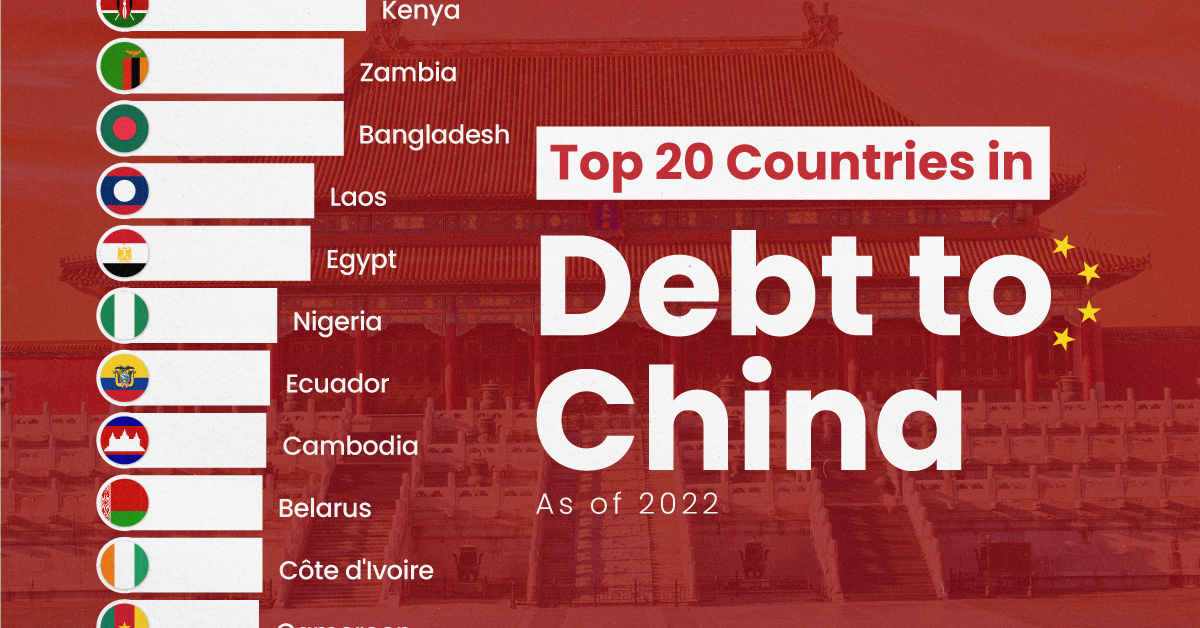
Ranked: The Top 20 Countries in Debt to China
This was originally posted on our Voronoi app. Download the app for free on iOS or Android and discover incredible data-driven charts from a variety of trusted sources.
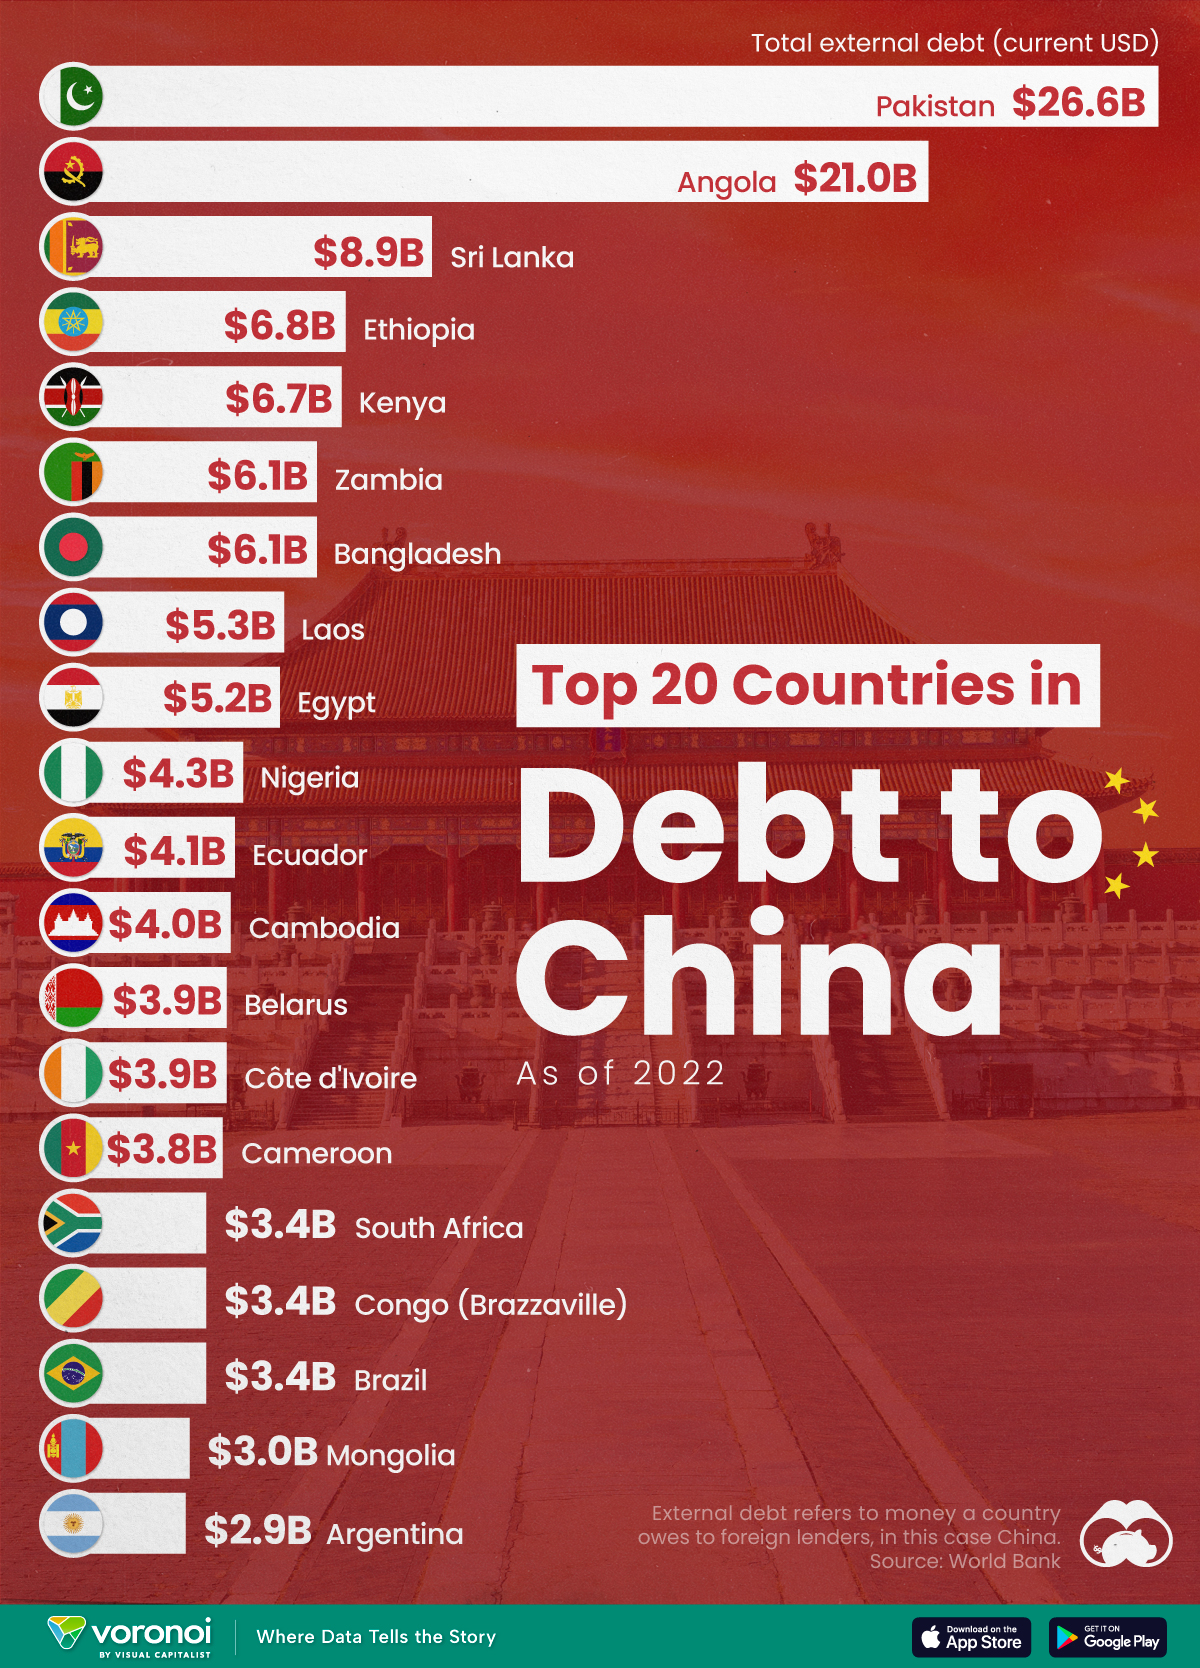
In this graphic, we ranked the top 20 countries by their amount of debt to China. These figures are as of 2022, and come from the World Bank (accessed via Yahoo Finance).
The data used to make this graphic can be found in the table below.
| Country | Total external debt to China ($B) |
|---|---|
| 🇵🇰 Pakistan | $26.6 |
| 🇦🇴 Angola | $21.0 |
| 🇱🇰 Sri Lanka | $8.9 |
| 🇪🇹 Ethiopia | $6.8 |
| 🇰🇪 Kenya | $6.7 |
| 🇧🇩 Bangladesh | $6.1 |
| 🇿🇲 Zambia | $6.1 |
| 🇱🇦 Laos | $5.3 |
| 🇪🇬 Egypt | $5.2 |
| 🇳🇬 Nigeria | $4.3 |
| 🇪🇨 Ecuador | $4.1 |
| 🇰🇭 Cambodia | $4.0 |
| 🇨🇮 Côte d'Ivoire | $3.9 |
| 🇧🇾 Belarus | $3.9 |
| 🇨🇲 Cameroon | $3.8 |
| 🇧🇷 Brazil | $3.4 |
| 🇨🇬 Republic of the Congo | $3.4 |
| 🇿🇦 South Africa | $3.4 |
| 🇲🇳 Mongolia | $3.0 |
| 🇦🇷 Argentina | $2.9 |
This dataset highlights Pakistan and Angola as having the largest debts to China by a wide margin. Both countries have taken billions in loans from China for various infrastructure and energy projects.
Critically, both countries have also struggled to manage their debt burdens. In February 2024, China extended the maturity of a $2 billion loan to Pakistan.
Soon after in March 2024, Angola negotiated a lower monthly debt payment with its biggest Chinese creditor, China Development Bank (CDB).
Could China be in Trouble?
China has provided developing countries with over $1 trillion in committed funding through its Belt and Road Initiative (BRI), a massive economic development project aimed at enhancing trade between China and countries across Asia, Africa, and Europe.
Many believe that this lending spree could be an issue in the near future.
According to a 2023 report by AidData, 80% of these loans involve countries in financial distress, raising concerns about whether participating nations will ever be able to repay their debts.
While China claims the BRI is a driver of global development, critics in the West have long warned that the BRI employs debt-trap diplomacy, a tactic where one country uses loans to gain influence over another.
Editor’s note: The debt shown in this visualization focuses only on direct external debt, and does not include publicly-traded, liquid, debt securities like bonds. Furthermore, it’s worth noting the World Bank data excludes some countries with data accuracy or reporting issues, such as Venezuela.
Learn More About Debt from Visual Capitalist
If you enjoyed this post, check out our breakdown of $97 trillion in global government debt.

-

 Wealth6 days ago
Charted: Which City Has the Most Billionaires in 2024?
-

 Mining2 weeks ago
Gold vs. S&P 500: Which Has Grown More Over Five Years?
-

 Uranium2 weeks ago
The World’s Biggest Nuclear Energy Producers
-

 Education2 weeks ago
How Hard Is It to Get Into an Ivy League School?
-

 Debt2 weeks ago
How Debt-to-GDP Ratios Have Changed Since 2000
-

 Sports2 weeks ago
The Highest Earning Athletes in Seven Professional Sports
-

 Science2 weeks ago
Visualizing the Average Lifespans of Mammals
-

 Brands1 week ago
How Tech Logos Have Evolved Over Time