Markets
Ranked: The Fastest Growing Economies In 2024
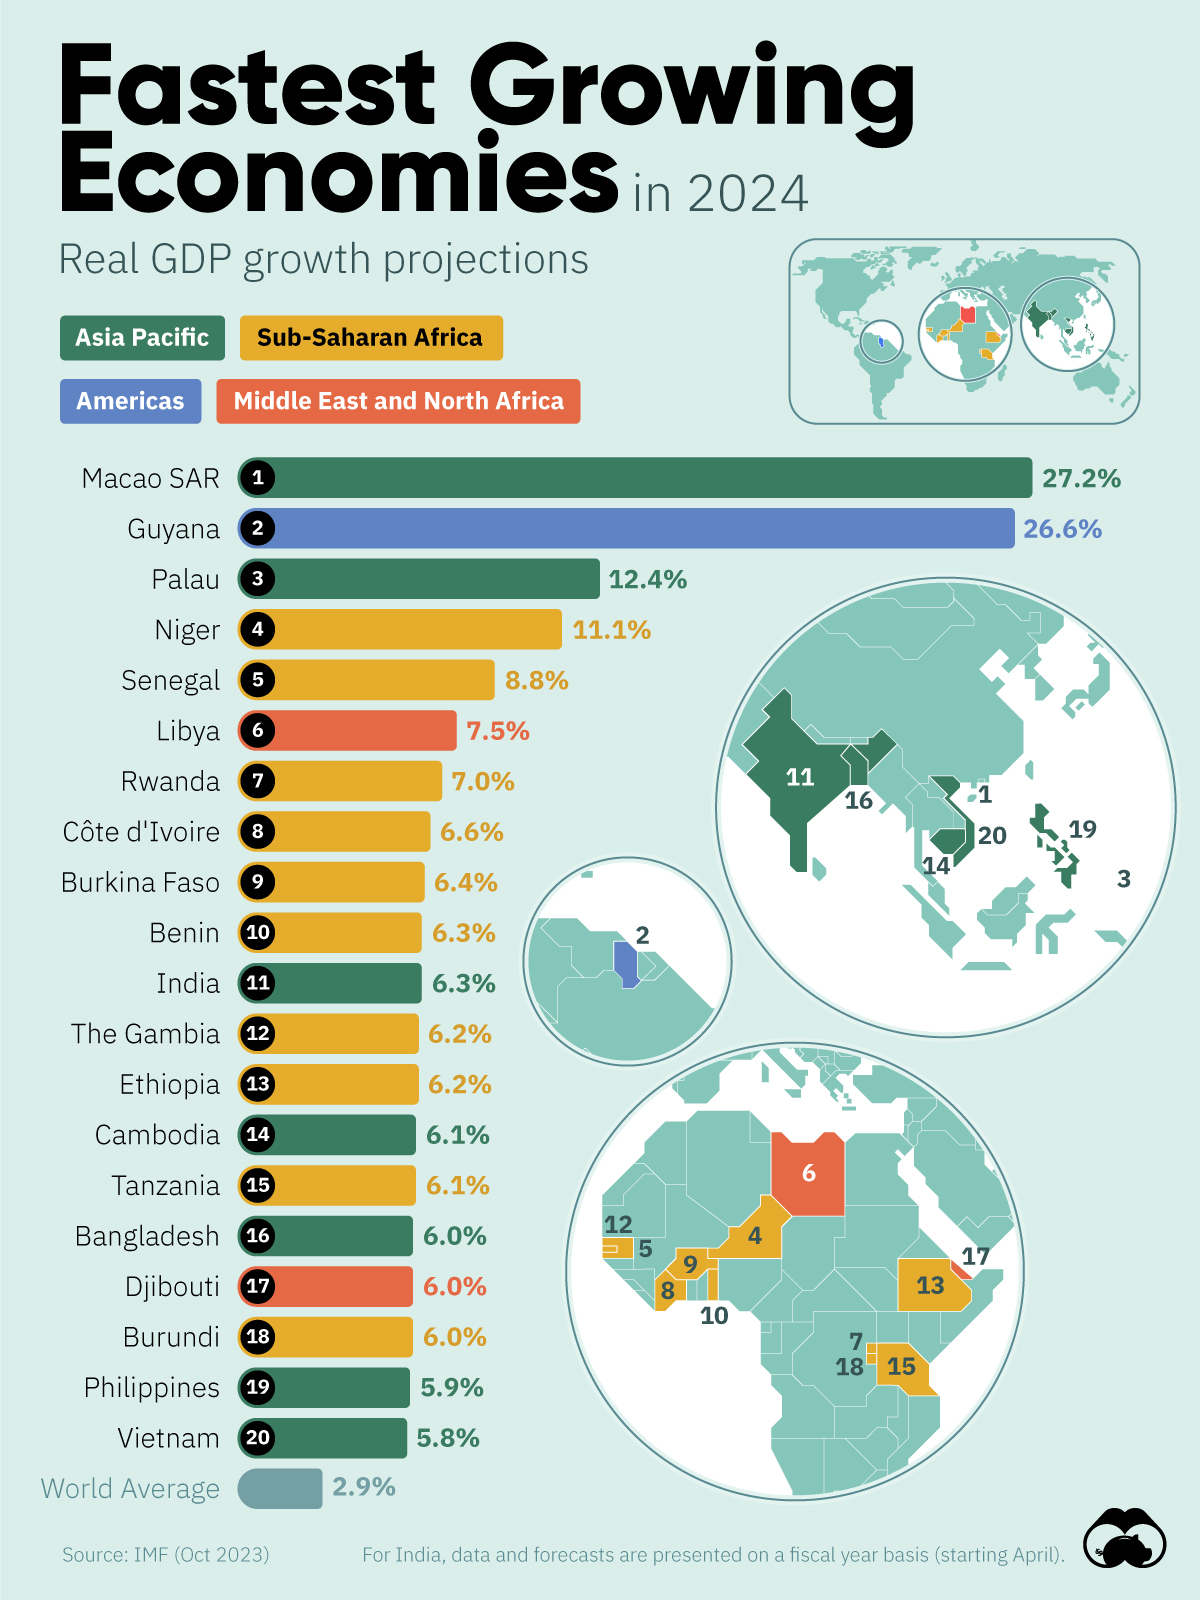
IMF Projections: The Fastest Growing Economies in 2024
Which countries will see the most economic growth in 2024?
To answer this question, we’ve visualized GDP growth forecasts from the IMF’s October 2023 World Economic Outlook. Unsurprisingly, many of these countries are located in Asia and Sub-Saharan Africa—two of the world’s fastest growing regions.
| Country | Region | GDP Growth 2024 (%) |
|---|---|---|
| 🇲🇴 Macao SAR | Asia Pacific | 27.2 |
| 🇬🇾 Guyana | Americas | 26.6 |
| 🇵🇼 Palau | Asia Pacific | 12.4 |
| 🇳🇪 Niger | Sub-Saharan Africa | 11.1 |
| 🇸🇳 Senegal | Sub-Saharan Africa | 8.8 |
| 🇱🇾 Libya | Middle East and North Africa | 7.5 |
| 🇷🇼 Rwanda | Sub-Saharan Africa | 7.0 |
| 🇨🇮 Côte d'Ivoire | Sub-Saharan Africa | 6.6 |
| 🇧🇫 Burkina Faso | Sub-Saharan Africa | 6.4 |
| 🇧🇯 Benin | Sub-Saharan Africa | 6.3 |
| 🇮🇳 India | Asia Pacific | 6.3 |
| 🇬🇲 The Gambia | Sub-Saharan Africa | 6.2 |
| 🇪🇹 Ethiopia | Sub-Saharan Africa | 6.2 |
| 🇰🇭 Cambodia | Asia Pacific | 6.1 |
| 🇹🇿 Tanzania | Sub-Saharan Africa | 6.1 |
| 🇧🇩 Bangladesh | Asia Pacific | 6.0 |
| 🇩🇯 Djibouti | Middle East and North Africa | 6.0 |
| 🇧🇮 Burundi | Sub-Saharan Africa | 6.0 |
| 🇵🇭 Philippines | Asia Pacific | 5.9 |
| 🇻🇳 Vietnam | Asia Pacific | 5.8 |
| 🌍 World Average | -- | 2.9 |
For India, data and forecasts are presented on a fiscal year basis (starting April). Continue reading below for additional context on these figures.
Highlights: Asia Pacific
The fastest growing economies in Asia are forecasted to be Macao (+27.2%), Palau (+12.4%), and India (+6.3%).
- The economy of Macao is heavily reliant on tourism, an industry that represents over 60% of the region’s jobs, as well as roughly 70% of its GDP.
- Palau is a tiny country consisting of 340 islands, representing an overall land area of 180 square miles (466 square kilometers). According to the U.S. State Department, tourism represents approximately 40% of Palau’s GDP.
- India, which recently became the world’s largest country by population, is expected to reach a peak of 1.7 billion people by 2064.
Highlights: Sub-Saharan Africa
Sub-Saharan Africa accounts for half of the top 20 list, with Niger (+11.1%) and Senegal (+8.8%) leading.
- A recent military coup could have serious implications on Niger’s future economic growth. The country’s Agadem oil field, which is majority owned by China National Petroleum Corporation (CNPC), could see its exports disrupted as a result of global sanctions.
- Senegal’s economy is also linked to the oil industry, meaning its growth could fluctuate in the years to come.
Oil Drives Growth for Guyana
Guyana (+26.6%), with a population of only 815,000, is expected to be the second fastest growing economy in 2024. Interestingly, it was the world’s fastest growing economy last year, with a 62% increase in GDP, and is likely to claim that title again in 2023 with expected growth of 37%.
This growth is largely driven by rising oil exports from Stabroek Block, an offshore oil field being developed by an Exxon Mobil-led consortium. According to BBC, Guyana has over 11 billion barrels in oil reserves.


Markets
Mapped: Europe’s GDP Per Capita, by Country
Which European economies are richest on a GDP per capita basis? This map shows the results for 44 countries across the continent.


Mapped: Europe’s GDP Per Capita, by Country (2024)
This was originally posted on our Voronoi app. Download the app for free on iOS or Android and discover incredible data-driven charts from a variety of trusted sources.
Europe is home to some of the largest and most sophisticated economies in the world. But how do countries in the region compare with each other on a per capita productivity basis?
In this map, we show Europe’s GDP per capita levels across 44 nations in current U.S. dollars. Data for this visualization and article is sourced from the International Monetary Fund (IMF) via their DataMapper tool, updated April 2024.
Europe’s Richest and Poorest Nations, By GDP Per Capita
Luxembourg, Ireland, and Switzerland, lead the list of Europe’s richest nations by GDP per capita, all above $100,000.
| Rank | Country | GDP Per Capita (2024) |
|---|---|---|
| 1 | 🇱🇺 Luxembourg | $131,380 |
| 2 | 🇮🇪 Ireland | $106,060 |
| 3 | 🇨🇭 Switzerland | $105,670 |
| 4 | 🇳🇴 Norway | $94,660 |
| 5 | 🇮🇸 Iceland | $84,590 |
| 6 | 🇩🇰 Denmark | $68,900 |
| 7 | 🇳🇱 Netherlands | $63,750 |
| 8 | 🇸🇲 San Marino | $59,410 |
| 9 | 🇦🇹 Austria | $59,230 |
| 10 | 🇸🇪 Sweden | $58,530 |
| 11 | 🇧🇪 Belgium | $55,540 |
| 12 | 🇫🇮 Finland | $55,130 |
| 13 | 🇩🇪 Germany | $54,290 |
| 14 | 🇬🇧 UK | $51,070 |
| 15 | 🇫🇷 France | $47,360 |
| 16 | 🇦🇩 Andorra | $44,900 |
| 17 | 🇲🇹 Malta | $41,740 |
| 18 | 🇮🇹 Italy | $39,580 |
| 19 | 🇨🇾 Cyprus | $37,150 |
| 20 | 🇪🇸 Spain | $34,050 |
| 21 | 🇸🇮 Slovenia | $34,030 |
| 22 | 🇪🇪 Estonia | $31,850 |
| 23 | 🇨🇿 Czech Republic | $29,800 |
| 24 | 🇵🇹 Portugal | $28,970 |
| 25 | 🇱🇹 Lithuania | $28,410 |
| 26 | 🇸🇰 Slovakia | $25,930 |
| 27 | 🇱🇻 Latvia | $24,190 |
| 28 | 🇬🇷 Greece | $23,970 |
| 29 | 🇭🇺 Hungary | $23,320 |
| 30 | 🇵🇱 Poland | $23,010 |
| 31 | 🇭🇷 Croatia | $22,970 |
| 32 | 🇷🇴 Romania | $19,530 |
| 33 | 🇧🇬 Bulgaria | $16,940 |
| 34 | 🇷🇺 Russia | $14,390 |
| 35 | 🇹🇷 Türkiye | $12,760 |
| 36 | 🇲🇪 Montenegro | $12,650 |
| 37 | 🇷🇸 Serbia | $12,380 |
| 38 | 🇦🇱 Albania | $8,920 |
| 39 | 🇧🇦 Bosnia & Herzegovina | $8,420 |
| 40 | 🇲🇰 North Macedonia | $7,690 |
| 41 | 🇧🇾 Belarus | $7,560 |
| 42 | 🇲🇩 Moldova | $7,490 |
| 43 | 🇽🇰 Kosovo | $6,390 |
| 44 | 🇺🇦 Ukraine | $5,660 |
| N/A | 🇪🇺 EU Average | $44,200 |
Note: Figures are rounded.
Three Nordic countries (Norway, Iceland, Denmark) also place highly, between $70,000-90,000. Other Nordic peers, Sweden and Finland rank just outside the top 10, between $55,000-60,000.
Meanwhile, Europe’s biggest economies in absolute terms, Germany, UK, and France, rank closer to the middle of the top 20, with GDP per capitas around $50,000.
Finally, at the end of the scale, Eastern Europe as a whole tends to have much lower per capita GDPs. In that group, Ukraine ranks last, at $5,660.
A Closer Look at Ukraine
For a broader comparison, Ukraine’s per capita GDP is similar to Iran ($5,310), El Salvador ($5,540), and Guatemala ($5,680).
According to experts, Ukraine’s economy has historically underperformed to expectations. After the fall of the Berlin Wall, the economy contracted for five straight years. Its transition to a Western, liberalized economic structure was overshadowed by widespread corruption, a limited taxpool, and few revenue sources.
Politically, its transformation from authoritarian regime to civil democracy has proved difficult, especially when it comes to institution building.
Finally, after the 2022 invasion of the country, Ukraine’s GDP contracted by 30% in a single year—the largest loss since independence. Large scale emigration—to the tune of six million refugees—is also playing a role.
Despite these challenges, the country’s economic growth has somewhat stabilized while fighting continues.

-

 Technology5 days ago
Mapped: The Number of AI Startups By Country
-

 Jobs2 weeks ago
The Best U.S. Companies to Work for According to LinkedIn
-

 Economy2 weeks ago
Ranked: The Top 20 Countries in Debt to China
-

 Politics2 weeks ago
Charted: Trust in Government Institutions by G7 Countries
-

 Energy2 weeks ago
Mapped: The Age of Energy Projects in Interconnection Queues, by State
-

 Mining2 weeks ago
Visualizing Global Gold Production in 2023
-

 Markets1 week ago
Visualized: Interest Rate Forecasts for Advanced Economies
-

 Economy1 week ago
The Most Valuable Companies in Major EU Economies