Markets
Ranked: The Best and Worst Pension Plans, by Country


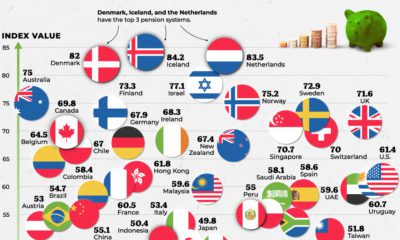
Ranked: Countries with the Best and Worst Pension Plans
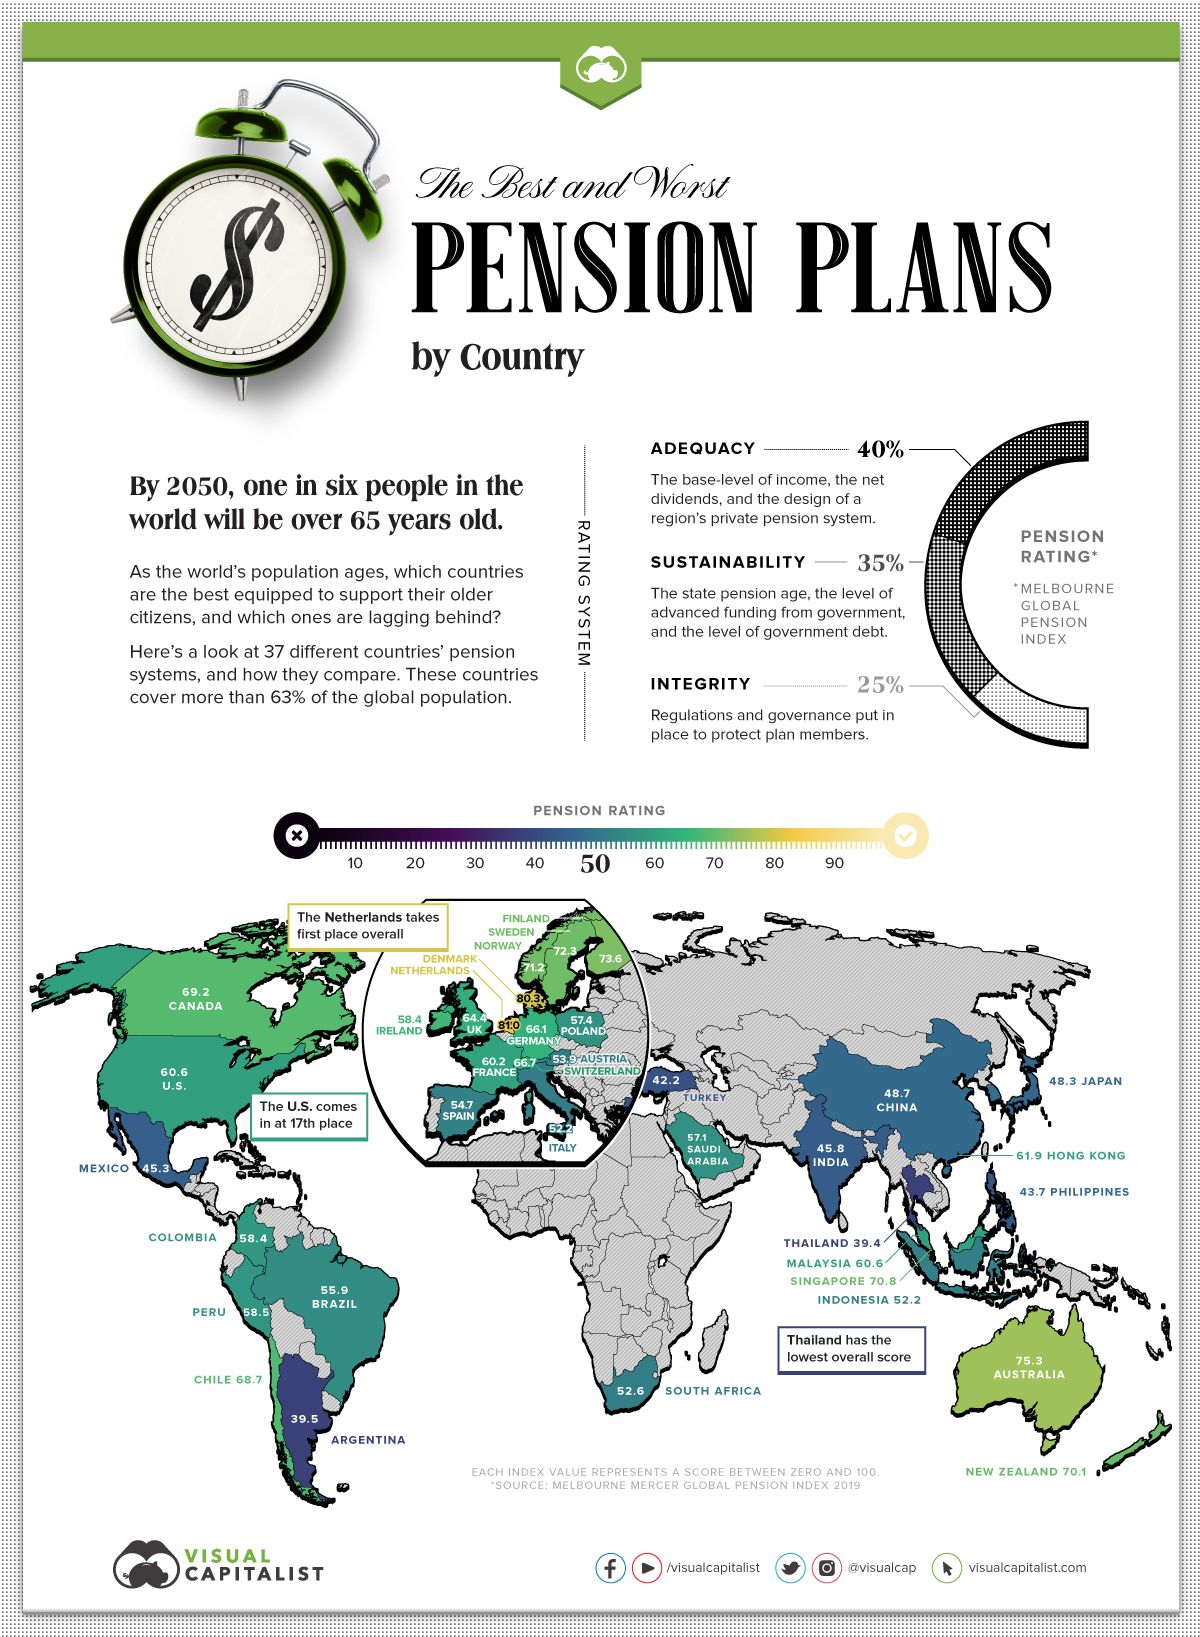
The global population is aging—by 2050, one in six people will be over the age of 65.
As our aging population nears retirement and gets closer to cashing in their pensions, countries need to ensure their pension systems can withstand the extra strain.
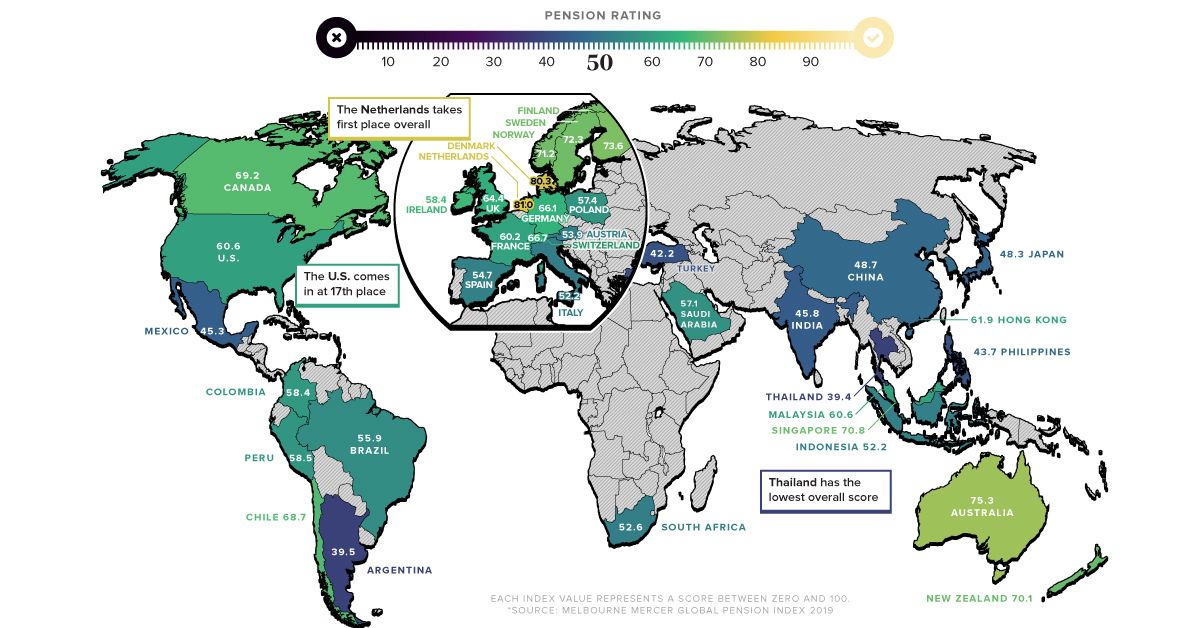
This graphic uses data from the Melbourne Mercer Global Pension Index (MMGPI) to showcase which countries are best equipped to support their older citizens, and which ones aren’t.
The Breakdown
Each country’s pension system has been shaped by its own economic and historical context. This makes it difficult to draw precise comparisons between countries—yet there are certain universal elements that typically lead to adequate and stable support for older citizens.
MMGPI organized these universal elements into three sub-indexes:
- Adequacy: The base-level of income, as well as the design of a region’s private pension system.
- Sustainability: The state pension age, the level of advanced funding from government, and the level of government debt.
- Integrity: Regulations and governance put in place to protect plan members.
These three measures were used to rank the pension system of 37 different countries, representing over 63% of the world’s population.
Here’s how each country ranked:
| Country | Overall Value | Adequacy | Sustainability | Integrity |
|---|---|---|---|---|
| Argentina | 39.5 | 43.1 | 31.9 | 44.4 |
| Australia | 75.3 | 70.3 | 73.5 | 85.7 |
| Austria | 53.9 | 68.2 | 22.9 | 74.4 |
| Brazil | 55.9 | 71.8 | 27.7 | 69.8 |
| Canada | 69.2 | 70 | 61.8 | 78.2 |
| Chile | 68.7 | 59.4 | 71.7 | 79.2 |
| China | 48.7 | 60.5 | 36.7 | 46.5 |
| Colombia | 58.4 | 61.4 | 46 | 70.8 |
| Denmark | 80.3 | 77.5 | 82 | 82.2 |
| Finland | 73.6 | 73.2 | 60.7 | 92.3 |
| France | 60.2 | 79.1 | 41 | 56.8 |
| Germany | 66.1 | 78.3 | 44.9 | 76.4 |
| Hong Kong | 61.9 | 54.5 | 54.5 | 86.9 |
| India | 45.8 | 39.9 | 44.9 | 56.3 |
| Indonesia | 52.2 | 46.7 | 47.6 | 67.5 |
| Ireland | 67.3 | 81.5 | 44.6 | 76.3 |
| Italy | 52.2 | 67.4 | 19 | 74.5 |
| Japan | 48.3 | 54.6 | 32.2 | 60.8 |
| Korea | 49.8 | 47.5 | 52.6 | 49.6 |
| Malaysia | 60.6 | 50.5 | 60.5 | 76.9 |
| Mexico | 45.3 | 37.5 | 57.1 | 41.3 |
| Netherlands | 81 | 78.5 | 78.3 | 88.9 |
| New Zealand | 70.1 | 70.9 | 61.5 | 80.7 |
| Norway | 71.2 | 71.6 | 56.8 | 90.6 |
| Peru | 58.5 | 60 | 52.4 | 64.7 |
| Philippines | 43.7 | 39 | 55.5 | 34.7 |
| Poland | 57.4 | 62.5 | 45.3 | 66 |
| Saudi Arabia | 57.1 | 59.6 | 50.5 | 62.2 |
| Singapore | 70.8 | 73.8 | 59.7 | 81.4 |
| South Africa | 52.6 | 42.3 | 46 | 78.4 |
| Spain | 54.7 | 70 | 26.9 | 69.1 |
| Sweden | 72.3 | 67.5 | 72 | 80.2 |
| Switzerland | 66.7 | 57.6 | 65.4 | 83 |
| Thailand | 39.4 | 35.8 | 38.8 | 46.1 |
| Turkey | 42.2 | 42.6 | 27.1 | 62.8 |
| UK | 64.4 | 60 | 55.3 | 84 |
| U.S. | 60.6 | 58.8 | 62.9 | 60.4 |
The Importance of Sustainability
While all three sub-indexes are important to consider when ranking a country’s pension system, sustainability is particularly significant in the modern context. This is because our global population is increasingly skewing older, meaning an influx of people will soon be cashing in their retirement funds. As a consequence, countries need to ensure their pension systems are sustainable over the long-term.
There are several factors that affect a pension system’s sustainability, including a region’s private pension system, the state pension age, and the balance between workers and retirees.
The country with the most sustainable pension system is Denmark. Not only does the country have a strong basic pension plan—it also has a mandatory occupational scheme, which means employers are obligated by law to provide pension plans for their employees.
Adequacy versus Sustainability
Several countries scored high on adequacy but ranked low when it came to sustainability. Here’s a comparison of both measures, and how each country scored:
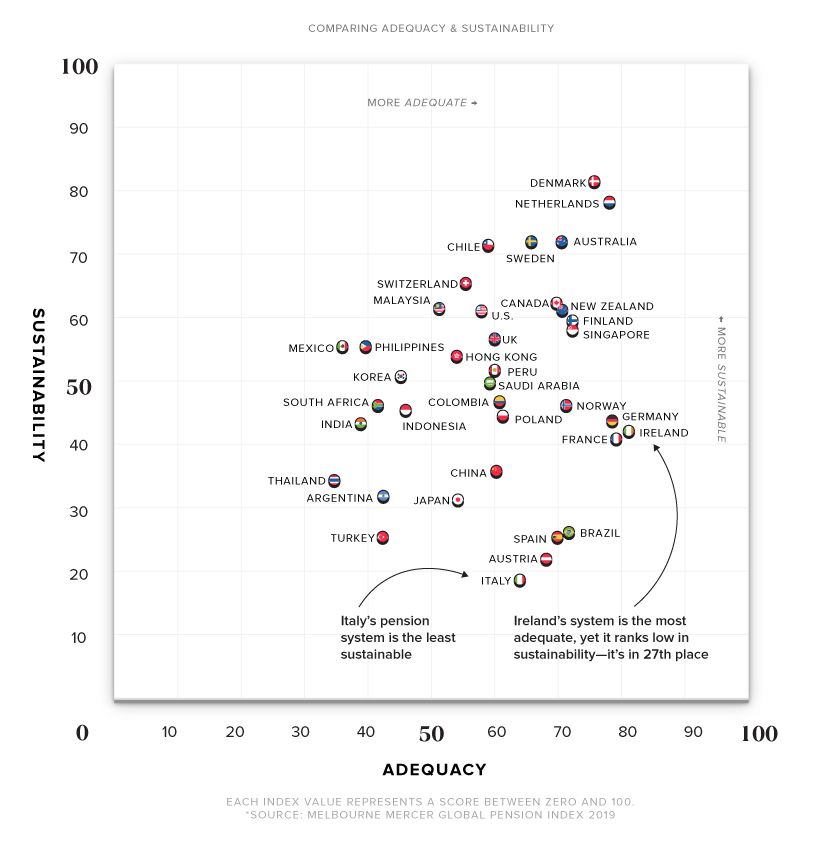
Ireland took first place for adequacy, but scored relatively low on the sustainability front at 27th place. This can be partly explained by Ireland’s low level of occupational coverage. The country also has a rapidly aging population, which skews the ratio of workers to retirees. By 2050, Ireland’s worker to retiree ratio is estimated to go from 5:1 to 2:1.
Similar to Ireland, Spain ranks high in adequacy but places extremely low in sustainability.
There are several possible explanations for this—while occupational pension schemes exist, they are optional and participation is low. Spain also has a low fertility rate, which means their worker-to-retiree ratio is expected to decrease.
Steps Towards a Better System
All countries have room for improvement—even the highest-ranking ones. Some general recommendations from MMGPI on how to build a better pension system include:
- Increasing the age of retirement: Helps maintain a more balanced worker-to-retiree ratio.
- Enforcing mandatory occupational schemes: Makes employers obligated to provide pension plans for their employees.
- Limiting access to benefits: Prevents people from dipping into their savings preemptively, thus preserving funds until retirement.
- Establishing strong pension assets to fund future liabilities: Ideally, these assets are more than 100% of a country’s GDP.
Pension systems across the globe are under an increasing amount of pressure. It’s time for countries to take a hard look at their pension systems to make sure they’re ready to support their aging population.


Markets
Visualizing Global Inflation Forecasts (2024-2026)
Here are IMF forecasts for global inflation rates up to 2026, highlighting a slow descent of price pressures amid resilient global growth.


Visualizing Global Inflation Forecasts (2024-2026)
Global inflation rates are gradually descending, but progress has been slow.
Today, the big question is if inflation will decline far enough to trigger easing monetary policy. So far, the Federal Reserve has held rates for nine months amid stronger than expected core inflation, which excludes volatile energy and food prices.
Yet looking further ahead, inflation forecasts from the International Monetary Fund (IMF) suggest that inflation will decline as price pressures ease, but the path of disinflation is not without its unknown risks.
This graphic shows global inflation forecasts, based on data from the April 2024 IMF World Economic Outlook.
Get the Key Insights of the IMF’s World Economic Outlook
Want a visual breakdown of the insights from the IMF’s 2024 World Economic Outlook report?
This visual is part of a special dispatch of the key takeaways exclusively for VC+ members.
Get the full dispatch of charts by signing up to VC+.
The IMF’s Inflation Outlook
Below, we show the IMF’s latest projections for global inflation rates through to 2026:
| Year | Global Inflation Rate (%) | Advanced Economies Inflation Rate (%) | Emerging Market and Developing Economies Inflation Rate (%) |
|---|---|---|---|
| 2019 | 3.5 | 1.4 | 5.1 |
| 2020 | 3.2 | 0.7 | 5.2 |
| 2021 | 4.7 | 3.1 | 5.9 |
| 2022 | 8.7 | 7.3 | 9.8 |
| 2023 | 6.8 | 4.6 | 8.3 |
| 2024 | 5.9 | 2.6 | 8.3 |
| 2025 | 4.5 | 2.0 | 6.2 |
| 2026 | 3.7 | 2.0 | 4.9 |
After hitting a peak of 8.7% in 2022, global inflation is projected to fall to 5.9% in 2024, reflecting promising inflation trends amid resilient global growth.
While inflation has largely declined due to falling energy and goods prices, persistently high services inflation poses challenges to mitigating price pressures. In addition, the IMF highlights the potential risk of an escalating conflict in the Middle East, which could lead to energy price shocks and higher shipping costs.
These developments could negatively affect inflation scenarios and prompt central banks to adopt tighter monetary policies. Overall, by 2026, global inflation is anticipated to decline to 3.7%—still notably above the 2% target set by several major economies.
Adding to this, we can see divergences in the path of inflation between advanced and emerging economies. While affluent nations are forecast to see inflation edge closer to the 2% target by 2026, emerging economies are projected to have inflation rates reach 4.9%—falling closer to their pre-pandemic averages.
Get the Full Analysis of the IMF’s Outlook on VC+
This visual is part of an exclusive special dispatch for VC+ members which breaks down the key takeaways from the IMF’s 2024 World Economic Outlook.
For the full set of charts and analysis, sign up for VC+.

-

 Culture6 days ago
The World’s Top Media Franchises by All-Time Revenue
-

 Science2 weeks ago
Visualizing the Average Lifespans of Mammals
-

 Brands2 weeks ago
How Tech Logos Have Evolved Over Time
-

 Energy2 weeks ago
Ranked: The Top 10 EV Battery Manufacturers in 2023
-

 Countries2 weeks ago
Countries With the Largest Happiness Gains Since 2010
-

 Economy2 weeks ago
VC+: Get Our Key Takeaways From the IMF’s World Economic Outlook
-

 Demographics2 weeks ago
The Countries That Have Become Sadder Since 2010
-

 Money1 week ago
Charted: Who Has Savings in This Economy?