Visualizing Global Inflation Forecasts (2024-2026)
The World’s Fastest Growing Emerging Markets (2024-2029 Forecast)
The Most Valuable Companies in Major EU Economies
Visualized: Interest Rate Forecasts for Advanced Economies
The Best U.S. Companies to Work for According to LinkedIn
All of the Grants Given by the U.S. CHIPS Act
Visualizing AI Patents by Country
How Tech Logos Have Evolved Over Time
Ranked: Semiconductor Companies by Industry Revenue Share
The Stock Performance of U.S. Chipmakers So Far in 2024
Ranked: The Top 20 Countries in Debt to China
Charted: Which Country Has the Most Billionaires in 2024?
Charted: Which City Has the Most Billionaires in 2024?
Charted: Who Has Savings in This Economy?
How Debt-to-GDP Ratios Have Changed Since 2000
The Cost of an EpiPen in Major Markets
Charted: Global Tobacco Use by Country and Sex
Visualized: What Lives in Your Gut Microbiome?
Charted: Average Years Left to Live by Age
Charted: The Average Cost of Insulin By Country
Mapped: The Age of Energy Projects in Interconnection Queues, by State
Ranked: The Top 10 EV Battery Manufacturers in 2023
The World’s Biggest Nuclear Energy Producers
The World’s Biggest Oil Producers in 2023
How Much Does the U.S. Depend on Russian Uranium?
The Largest Earthquakes in the New York Area (1970-2024)
Mapped: Average Wages Across Europe
Mapped: Asia’s Population Patterns by Density
A Map of Global Happiness By Country in 2024
Mapped: Population Growth by Region (1900-2050F)
Visualizing Global Gold Production in 2023
Gold vs. S&P 500: Which Has Grown More Over Five Years?
Charted: The Value Gap Between the Gold Price and Gold Miners
Charted: Global Uranium Reserves, by Country
The Carbon Footprint of Major Travel Methods
Ranking the Top 15 Countries by Carbon Tax Revenue
Ranked: The Countries With the Most Air Pollution in 2023
Top Countries By Forest Growth Since 2001
Ranked: Top Countries by Total Forest Loss Since 2001
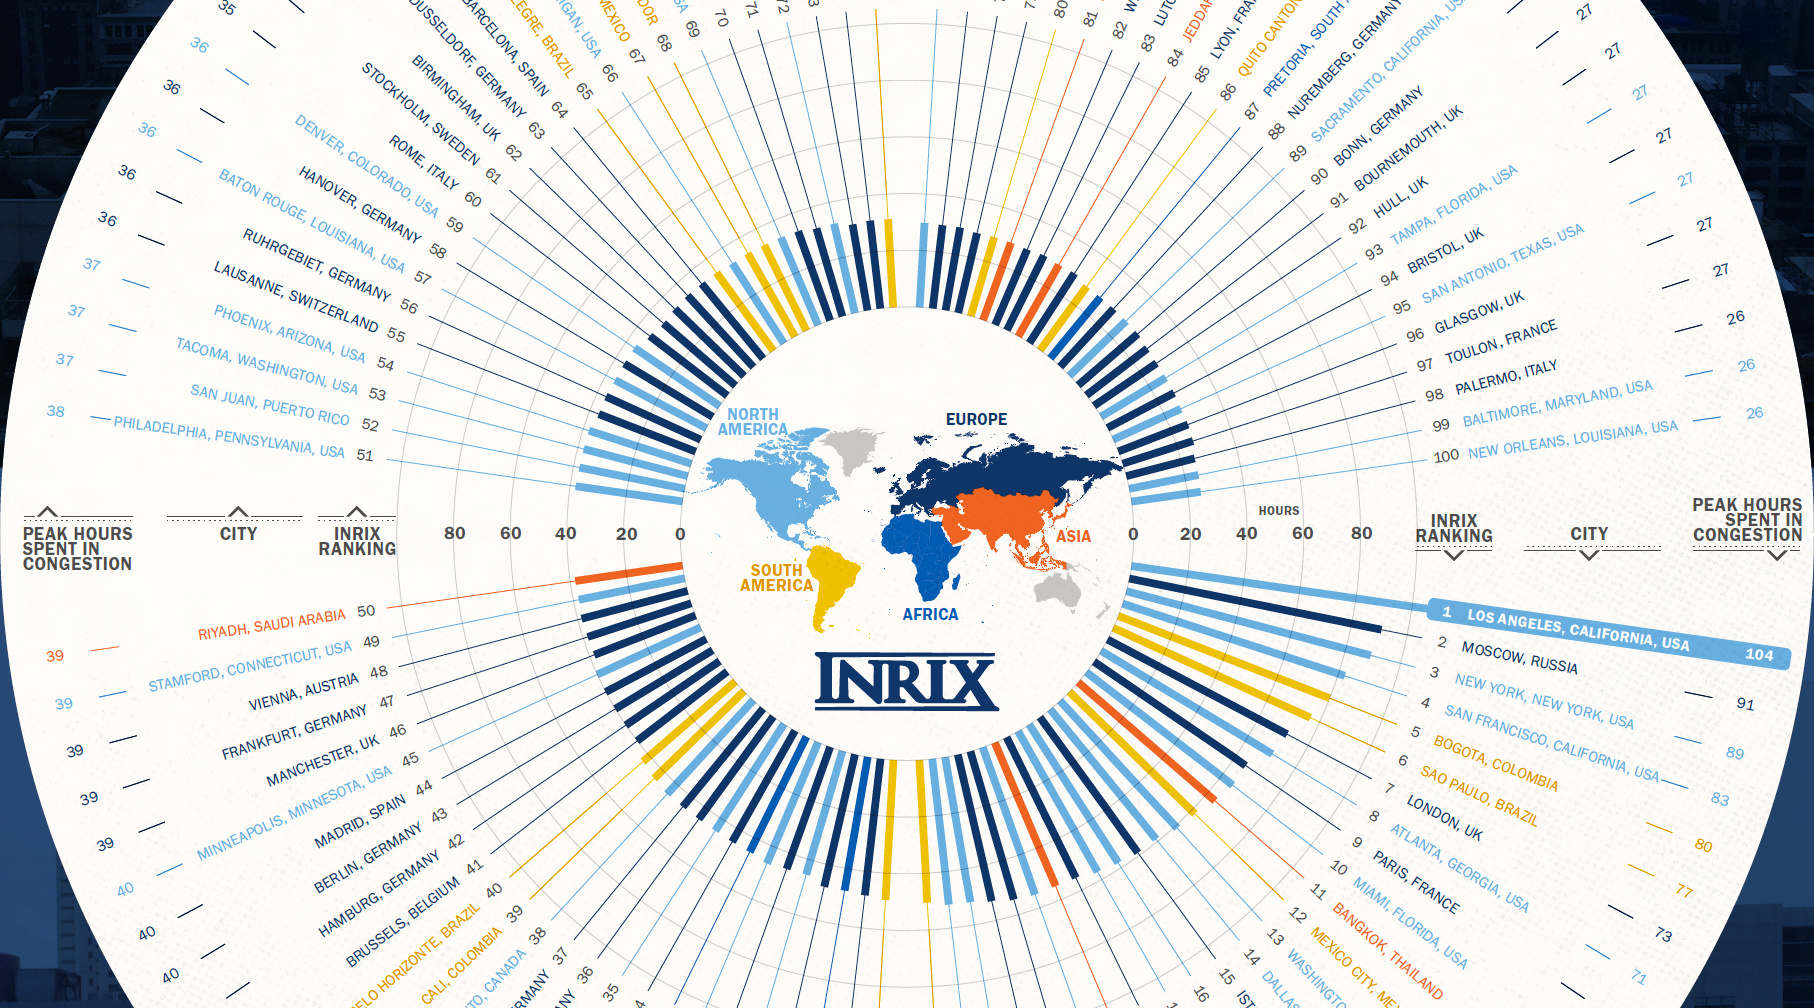
The Most Congested Cities For a higher resolution version of this infographic, click here. No matter what city you live in, traffic is something you probably...
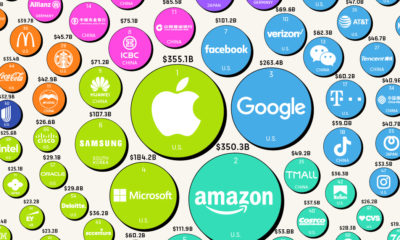
The Top 100 Most Valuable Brands in 2022 View a higher resolution version of this graphic. Given the elusive nature of brands, determining a brand’s financial...
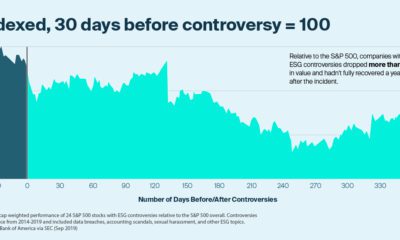
...2020-02-01 1.8% 2020-03-01 1.9% 2020-04-01 3.5% 2020-05-01 4.0% 2020-06-01 4.5% 2020-07-01 4.1% 2020-08-01 4.1% 2020-09-01 4.0% 2020-10-01 3.9% 2020-11-01 3.7% 2020-12-01 3.9% 2021-01-01 3.8% 2021-02-01 3.6%...
...of mobile gaming and AR/VR. Learn about the $100 billion video games market in this giant infographic. Sponsored8 years ago The Extraordinary Raw Materials in an...
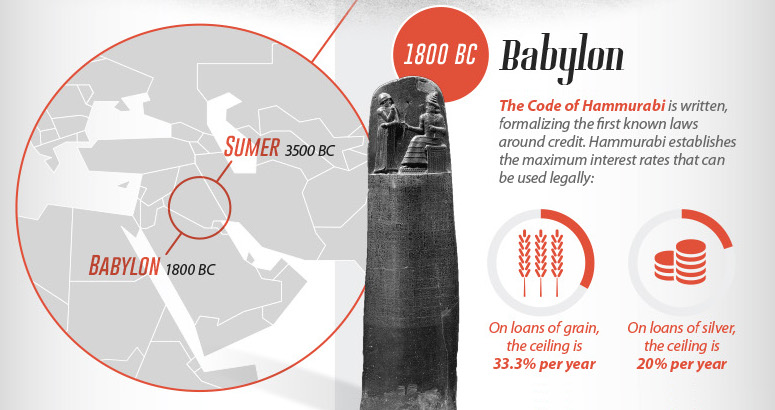
Consumer credit may seem like a fairly new invention – but it’s actually been around for more than 5,000 years! In fact, many millennia before the...
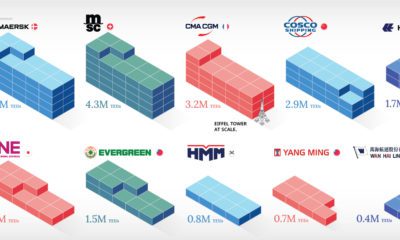
Visualizing the World’s Largest Container Shipping Companies Did you know that 80% of the global goods trade is transported over sea? Given the scale of human...
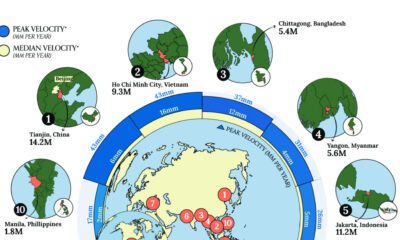
Which Coastal Cities Are Sinking the Fastest? This was originally posted on our Voronoi app. Download the app for free on iOS or Android and discover...
The World’s Top 50 Science and Technology Hubs This was originally posted on our Voronoi app. Download the app for free on iOS or Android and...
...4.9% 82.6% 🇺🇦 Ukraine 8 60.4% 10,856 bps (100.85%) 2.9% 49% 1 basis point (bps) = 0.01% Why are Ukraine’s Bond Yields so High? Ukraine has...
Visualizing Wealth Distribution in America This was originally posted on our Voronoi app. Download the app for free on iOS or Android and discover incredible data-driven...


 Creator Program


