Misc
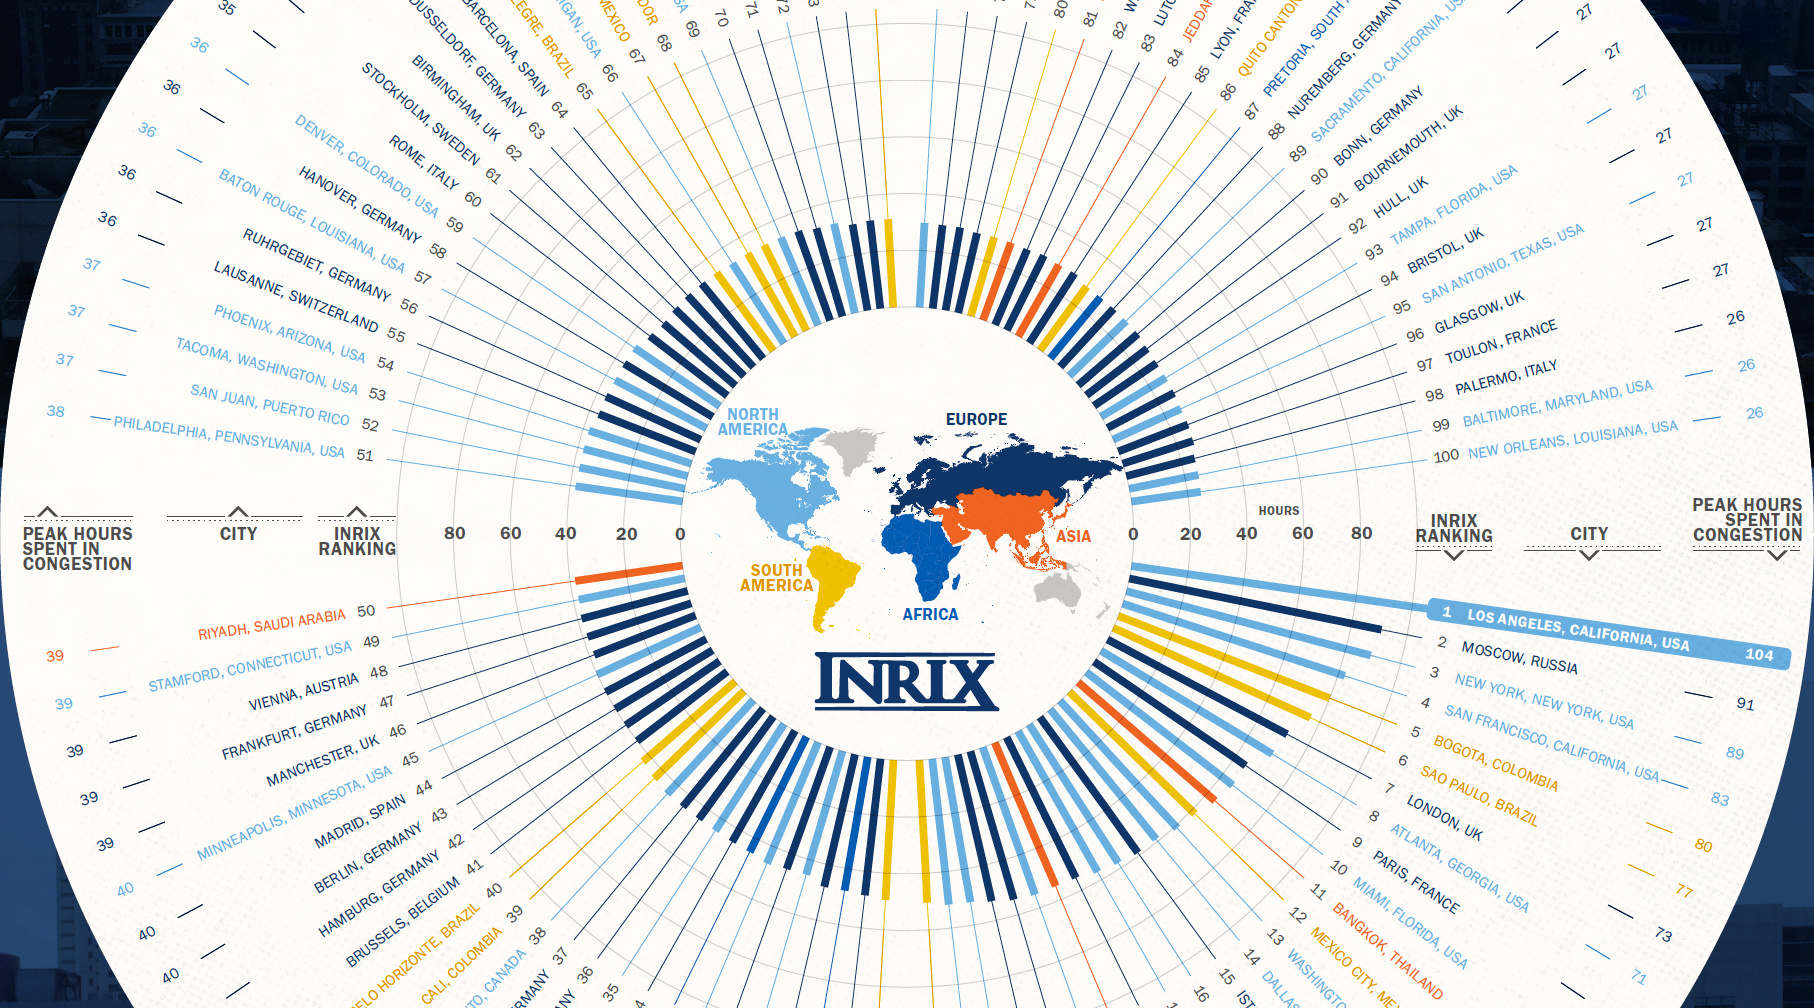
The Most Congested Cities in the World
Click here for a larger version of the infographic:
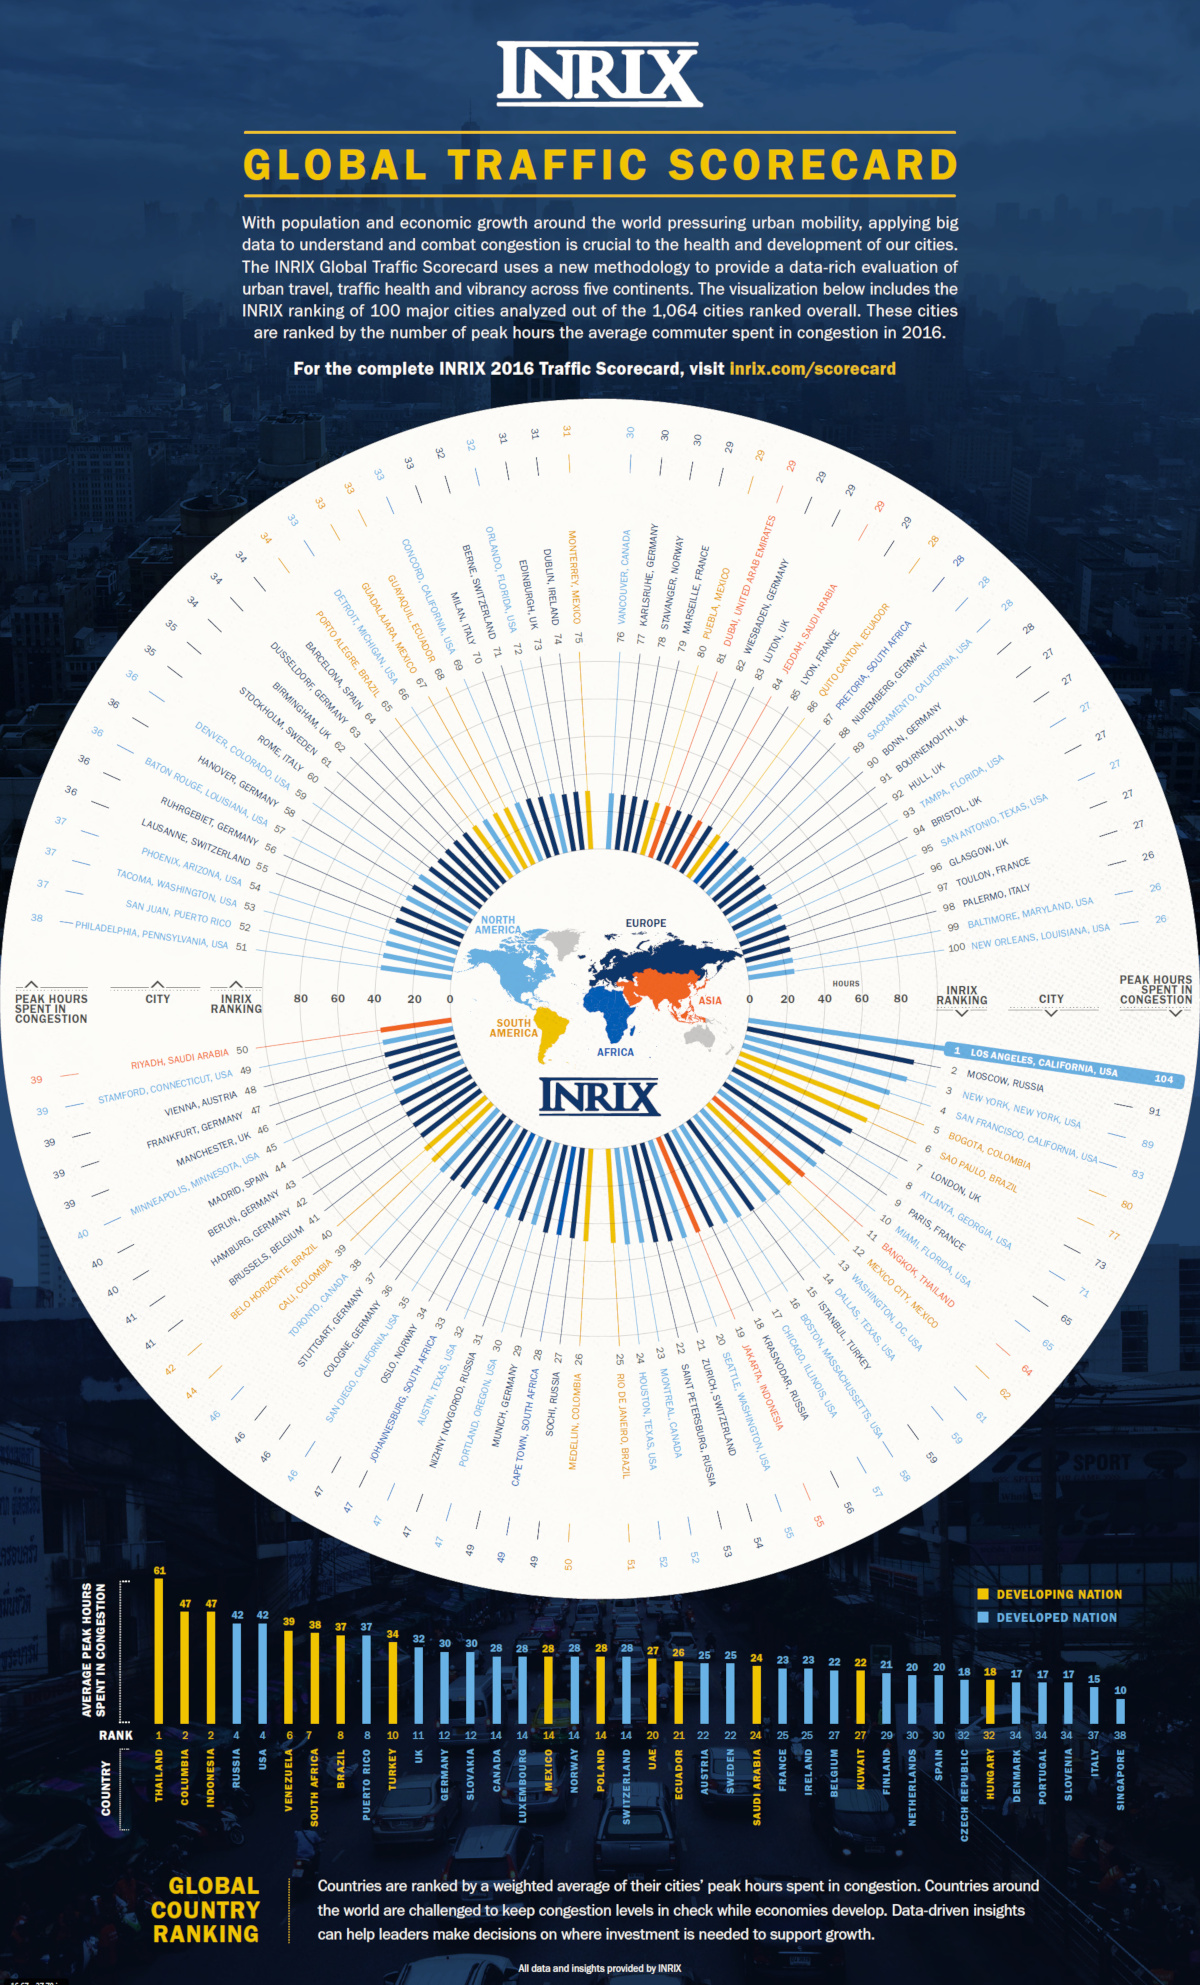
The Most Congested Cities
For a higher resolution version of this infographic, click here.
No matter what city you live in, traffic is something you probably dread being stuck in.
Whether it is the slow-moving I-95 in New York City or the molasses-like trip from East Hollywood to Santa Monica in L.A., it’s estimated that traffic congestion costs the United States alone a whopping sum of $300 billion per year in gas and time.
The World’s Worst Traffic
Which city has the ultimate distinction of having the world’s most horrific traffic?
Today’s infographic comes to us from INRIX via their Global Traffic Scorecard 2016, and it highlights the most congested cities around the globe. The report looks at average hours spent in congestion for 1,064 cities in 38 countries, as well as the percent of time spent in traffic.
Here’s a Top 10 list you don’t want to see your city on:
| Rank | City | Country | Hours Spent in Congestion | Driving Time in Congestion |
|---|---|---|---|---|
| #1 | Los Angeles | USA | 104.1 | 13% |
| #2 | Moscow | Russia | 91.4 | 25% |
| #3 | New York | USA | 89.4 | 13% |
| #4 | San Francisco | USA | 82.6 | 13% |
| #5 | Bogota | Colombia | 79.8 | 32% |
| #6 | Sao Paulo | Brazil | 77.2 | 21% |
| #7 | London | UK | 73.4 | 13% |
| #8 | Magnitogorsk | Russia | 71.1 | 42% |
| #9 | Atlanta | USA | 70.8 | 10% |
| #10 | Paris | France | 65.3 | 11% |
Taking the top spot was Los Angeles, where drivers spent an average 104 hours stuck in the city’s legendary traffic jams. The cost of this congestion, measured in wasted time and fuel, was $9.7 billion – a number that works out to $2,408 per driver!


VC+
VC+: Get Our Key Takeaways From the IMF’s World Economic Outlook
A sneak preview of the exclusive VC+ Special Dispatch—your shortcut to understanding IMF’s World Economic Outlook report.

Have you read IMF’s latest World Economic Outlook yet? At a daunting 202 pages, we don’t blame you if it’s still on your to-do list.
But don’t worry, you don’t need to read the whole April release, because we’ve already done the hard work for you.
To save you time and effort, the Visual Capitalist team has compiled a visual analysis of everything you need to know from the report—and our upcoming VC+ Special Dispatch will be available exclusively to VC+ members on Thursday, April 25th.
If you’re not already subscribed to VC+, make sure you sign up now to receive the full analysis of the IMF report, and more (we release similar deep dives every week).
For now, here’s what VC+ members can expect to receive.
Your Shortcut to Understanding IMF’s World Economic Outlook
With long and short-term growth prospects declining for many countries around the world, this Special Dispatch offers a visual analysis of the key figures and takeaways from the IMF’s report including:
- The global decline in economic growth forecasts
- Real GDP growth and inflation forecasts for major nations in 2024
- When interest rate cuts will happen and interest rate forecasts
- How debt-to-GDP ratios have changed since 2000
- And much more!

Get the Full Breakdown in the Next VC+ Special Dispatch
VC+ members will receive the full Special Dispatch on Thursday, April 25th.
Make sure you join VC+ now to receive exclusive charts and the full analysis of key takeaways from IMF’s World Economic Outlook.
Don’t miss out. Become a VC+ member today.
What You Get When You Become a VC+ Member
VC+ is Visual Capitalist’s premium subscription. As a member, you’ll get the following:
- Special Dispatches: Deep dive visual briefings on crucial reports and global trends
- Markets This Month: A snappy summary of the state of the markets and what to look out for
- The Trendline: Weekly curation of the best visualizations from across the globe
- Global Forecast Series: Our flagship annual report that covers everything you need to know related to the economy, markets, geopolitics, and the latest tech trends
- VC+ Archive: Hundreds of previously released VC+ briefings and reports that you’ve been missing out on, all in one dedicated hub
You can get all of the above, and more, by joining VC+ today.

-

 Markets1 week ago
U.S. Debt Interest Payments Reach $1 Trillion
-

 Markets2 weeks ago
Ranked: The Most Valuable Housing Markets in America
-

 Money2 weeks ago
Which States Have the Highest Minimum Wage in America?
-

 AI2 weeks ago
Ranked: Semiconductor Companies by Industry Revenue Share
-

 Markets2 weeks ago
Ranked: The World’s Top Flight Routes, by Revenue
-

 Countries2 weeks ago
Population Projections: The World’s 6 Largest Countries in 2075
-

 Markets2 weeks ago
The Top 10 States by Real GDP Growth in 2023
-

 Money2 weeks ago
The Smallest Gender Wage Gaps in OECD Countries