Mapped: Europe’s GDP Per Capita, by Country
The Growth of a $1,000 Equity Investment, by Stock Market
Mapped: The Most Valuable Company in Each Southeast Asian Country
Visualizing Global Inflation Forecasts (2024-2026)
The World’s Fastest Growing Emerging Markets (2024-2029 Forecast)
Countries With the Highest Rates of Crypto Ownership
Mapped: The Number of AI Startups By Country
All of the Grants Given by the U.S. CHIPS Act
Visualizing AI Patents by Country
How Tech Logos Have Evolved Over Time
Visualizing the Tax Burden of Every U.S. State
Charted: What Frustrates Americans About the Tax System
Ranked: The Top 20 Countries in Debt to China
Charted: Which Country Has the Most Billionaires in 2024?
Charted: Which City Has the Most Billionaires in 2024?
Which Countries Have the Highest Infant Mortality Rates?
Life Expectancy by Region (1950-2050F)
What Causes Preventable Child Deaths?
The Cost of an EpiPen in Major Markets
Charted: Global Tobacco Use by Country and Sex
Who’s Building the Most Solar Energy?
Mapped: The Age of Energy Projects in Interconnection Queues, by State
Ranked: The Top 10 EV Battery Manufacturers in 2023
The World’s Biggest Nuclear Energy Producers
The World’s Biggest Oil Producers in 2023
Mapped: U.S. Immigrants by Region
Mapped: Southeast Asia’s GDP Per Capita, by Country
The Largest Earthquakes in the New York Area (1970-2024)
Mapped: Average Wages Across Europe
Mapped: Asia’s Population Patterns by Density
Visualizing Copper Production by Country in 2023
Where the World’s Aluminum is Smelted, by Country
Visualizing Global Gold Production in 2023
Gold vs. S&P 500: Which Has Grown More Over Five Years?
How People Get Around in America, Europe, and Asia
The Carbon Footprint of Major Travel Methods
Ranking the Top 15 Countries by Carbon Tax Revenue
Ranked: The Countries With the Most Air Pollution in 2023
Top Countries By Forest Growth Since 2001
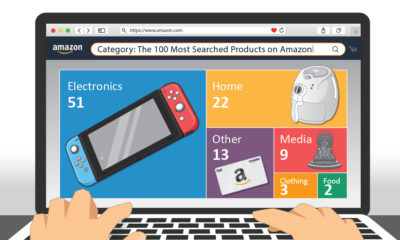
This graphic highlights the top product searches on Amazon in the U.S., providing a glimpse of what items American consumers are after.
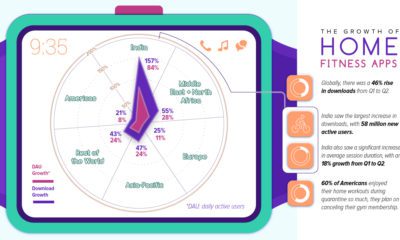
During lockdown, fitness apps have seen a huge spike in downloads worldwide. Which regions are driving this growth?
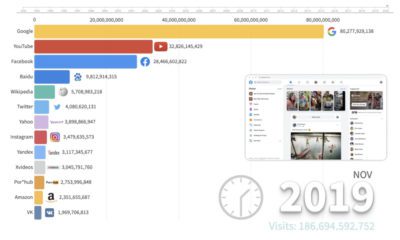
This animation provides an interesting overview of the websites with the highest traffic over the last few decades, and how the rankings have changed.
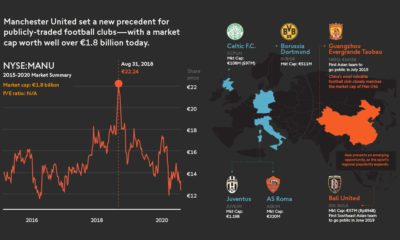
Football’s global appeal has boosted the game into a billion-dollar industry. How can fans and investors cash in on their favorite clubs?
A countdown of our top infographics from 2019, including some of our most viewed graphics and other hand-picked entries from our staff.
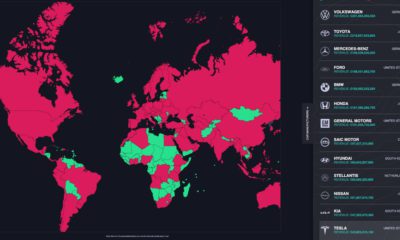
This graphic looks at the revenue of the world’s top carmakers and compares them to the GDP of 196 countries worldwide.
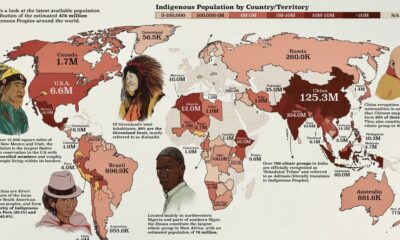
This map by shows the population distribution of the roughly 476 million Indigenous groups around the world.
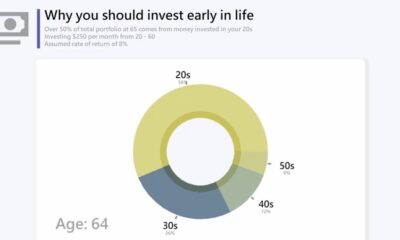
This animation highlights the benefits of investing early on in life by showing how much of your total earnings come from your early years.
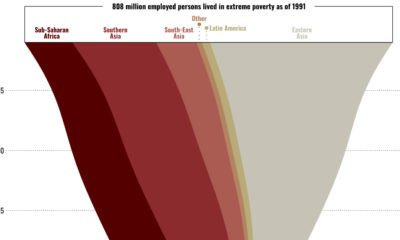
This graphic shows the regional breakdown of the world’s working poor, and how this demographic has changed since 1995.
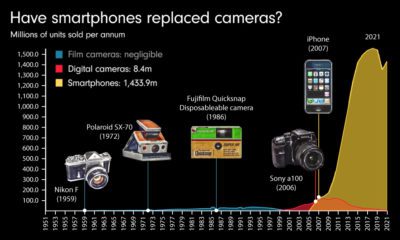
Have smartphones fully replaced cameras? This video charts 70 years of camera sales and how smartphones have affected the market.


 Creator Program