Investor Education
Animated Chart: The Benefits of Investing Early in Life
Article/Editing:
The Benefits of Investing Early in Life
“Time in the market beats timing the market.”
This quote by Ken Fisher, founder of Fisher Investments, speaks to the often-overlooked benefits of long-term investing.
Timing the market for the perfect trade can be a tricky and potentially dangerous proposition—even for the most seasoned investors. That’s why the buy and hold strategy has been a popular investment tactic among many successful investors like Warren Buffett and Jack Bogle.
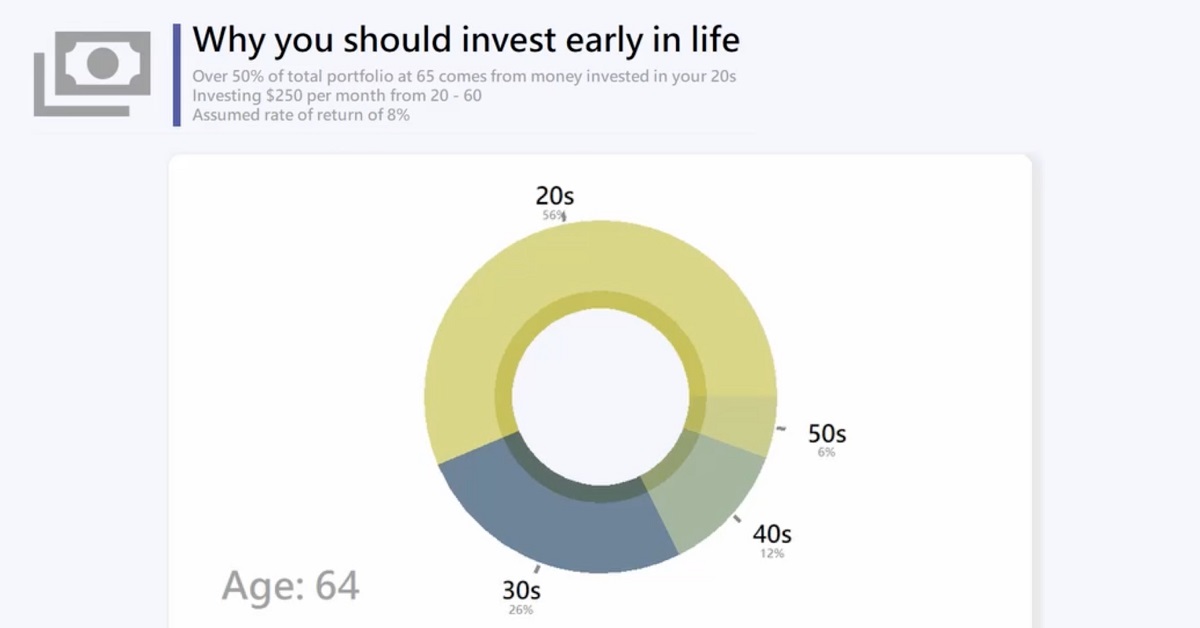
And thanks to the power of compound interest, it’s important to start as early as possible. This animated graphic by Sjoerd Tilmans shows the benefits of investing early on in life, and just how much of your total earnings can come from your early years.
Compound Interest
The reason that investing early is so beneficial is because of compound interest. Simply put, compound interest is the phenomenon of earning interest on interest.
For instance, let’s say you make an initial deposit of $1,000 in an account that returns 10% annually. By the end of the year, you’ll earn $100 in interest. In the following year, with your total now at $1,100 and assuming the same rate of return, you’ll earn $110 in interest.
And these annual gains, while starting off small, add up significantly over time.
What If I Double Down When I Have More Money?
What happens when you wait to invest?
Though you should only invest money that you don’t need access to in the short term, the reality is that waiting will have consequences on your long-term gains.
For example, let’s say you started investing at 20 years old, and you invest $250 each month with an 8% annual rate of return. By the time you reach 65, over 50% of your total portfolio would have come from money that you invested in your 20s.
Someone who invests a decade later than their peer with double the amount will see actually see lower returns in the long run. For a more thorough breakdown, check out this infographic that goes into detail about the power of compound interest.
Long-Term Investing is Declining
Despite the benefits of long-term investing, it seems that many investors these days are opting for shorter holding periods and quick gains over long-term growth.
For instance, according to the NYSE, the average holding period for stocks in the late 1950s was 8 years. By June 2020, the average holding period had dropped to 5.5 months.
That being said, recent interest rate hikes and threats of a recession could lead to a major slowdown. While quick-win investing has been trending in recent years, we may very well see long-term investment strategies regain some footing.

This article was published as a part of Visual Capitalist's Creator Program, which features data-driven visuals from some of our favorite Creators around the world.


Investor Education
The 20 Most Common Investing Mistakes, in One Chart
Here are the most common investing mistakes to avoid, from emotionally-driven investing to paying too much in fees.
The 20 Most Common Investing Mistakes
This was originally posted on Advisor Channel. Sign up to the free mailing list to get beautiful visualizations on financial markets that help advisors and their clients.
No one is immune to errors, including the best investors in the world.
Fortunately, investing mistakes can provide valuable lessons over time, providing investors an opportunity to gain insights on investing—and build more resilient portfolios.
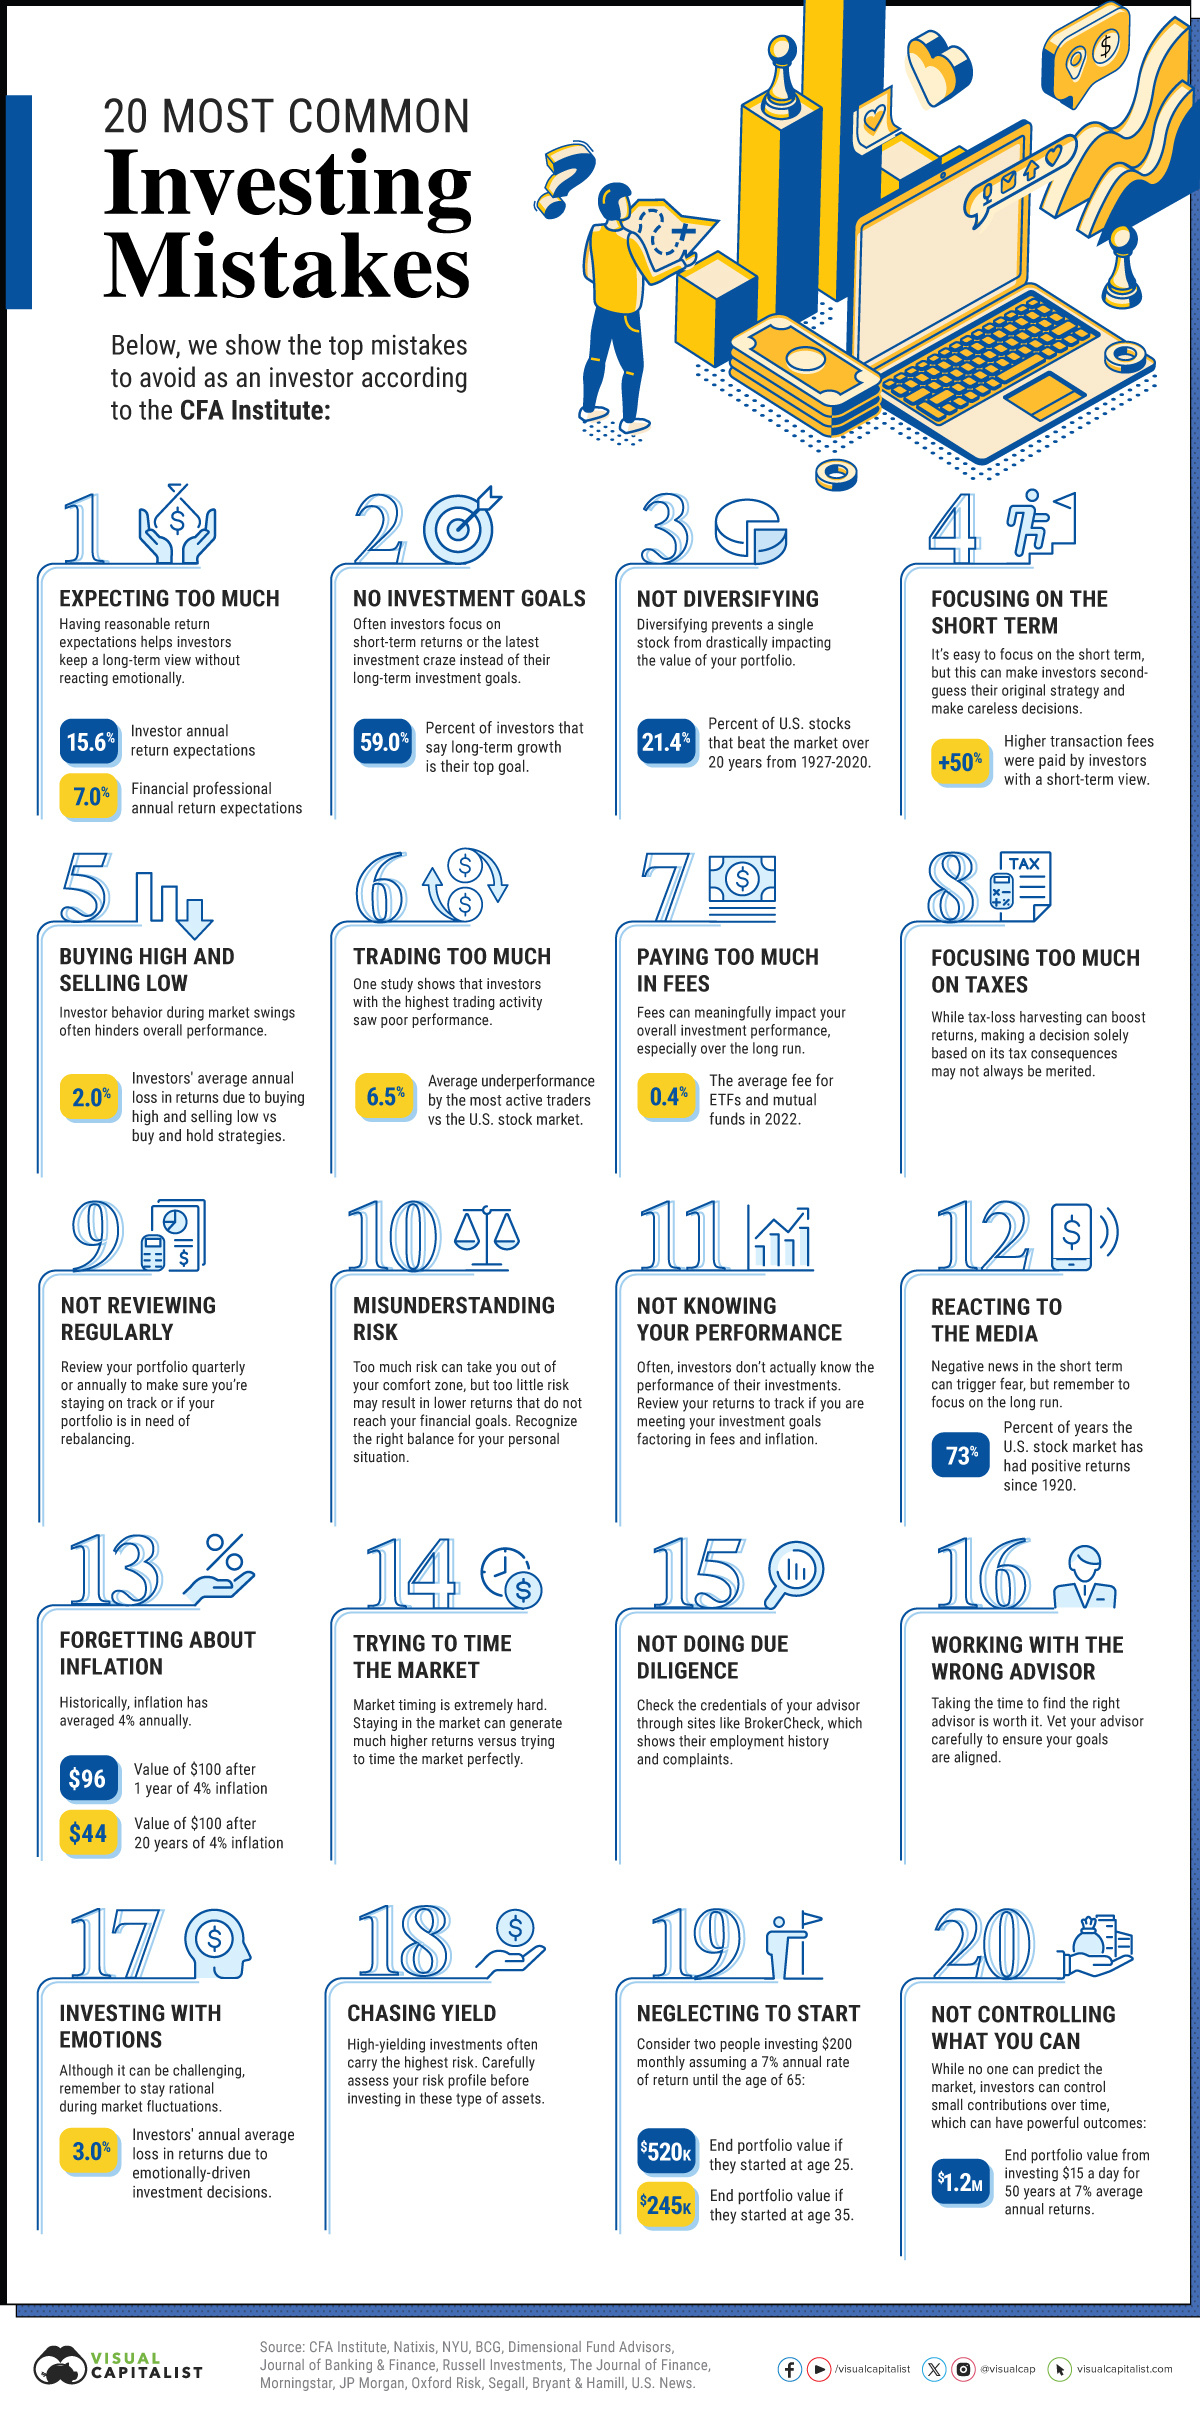
This graphic shows the top 20 most common investing mistakes to watch out for, according to the CFA Institute.
20 Investment Mistakes to Avoid
From emotionally-driven investment decisions to paying too much on fees, here are some of the most common investing mistakes:
| Top 20 Mistakes | Description |
|---|---|
| 1. Expecting Too Much | Having reasonable return expectations helps investors keep a long-term view without reacting emotionally. |
| 2. No Investment Goals | Often investors focus on short-term returns or the latest investment craze instead of their long-term investment goals. |
| 3. Not Diversifying | Diversifying prevents a single stock from drastically impacting the value of your portfolio. |
| 4. Focusing on the Short Term | It’s easy to focus on the short term, but this can make investors second-guess their original strategy and make careless decisions. |
| 5. Buying High and Selling Low | Investor behavior during market swings often hinders overall performance. |
| 6. Trading Too Much | One study shows that the most active traders underperformed the U.S. stock market by 6.5% on average annually. Source: The Journal of Finance |
| 7. Paying Too Much in Fees | Fees can meaningfully impact your overall investment performance, especially over the long run. |
| 8. Focusing Too Much on Taxes | While tax-loss harvesting can boost returns, making a decision solely based on its tax consequences may not always be merited. |
| 9. Not Reviewing Investments Regularly | Review your portfolio quarterly or annually to make sure you’re staying on track or if your portfolio is in need of rebalancing. |
| 10. Misunderstanding Risk | Too much risk can take you out of your comfort zone, but too little risk may result in lower returns that do not reach your financial goals. Recognize the right balance for your personal situation. |
| 11. Not Knowing Your Performance | Often, investors don’t actually know the performance of their investments. Review your returns to track if you are meeting your investment goals factoring in fees and inflation. |
| 12. Reacting to the Media | Negative news in the short-term can trigger fear, but remember to focus on the long run. |
| 13. Forgetting About Inflation | Historically, inflation has averaged 4% annually. Value of $100 at 4% Annual Inflation After 1 Year: $96 After 20 Years: $44 |
| 14. Trying to Time the Market | Market timing is extremely hard. Staying in the market can generate much higher returns versus trying to time the market perfectly. |
| 15. Not Doing Due Diligence | Check the credentials of your advisor through sites like BrokerCheck, which shows their employment history and complaints. |
| 16. Working With the Wrong Advisor | Taking the time to find the right advisor is worth it. Vet your advisor carefully to ensure your goals are aligned. |
| 17. Investing With Emotions | Although it can be challenging, remember to stay rational during market fluctuations. |
| 18. Chasing Yield | High-yielding investments often carry the highest risk. Carefully assess your risk profile before investing in these types of assets. |
| 19. Neglecting to Start | Consider two people investing $200 monthly assuming a 7% annual rate of return until the age of 65. If one person started at age 25, their end portfolio would be $520K, if the other started at 35 it would total about $245K. |
| 20. Not Controlling What You Can | While no one can predict the market, investors can control small contributions over time, which can have powerful outcomes. |
For instance, not properly diversifying can expose you to higher risk. Holding one concentrated position can drastically impact the value of your portfolio when prices fluctuate.
In fact, one study shows that the optimal diversification for a large-cap portfolio is holding 15 stocks. In this way, it helps capture the highest possible return relative to risk. When it came to a small-cap portfolio, the number of stocks rose to 26 for optimal risk reduction.
It’s worth noting that one size does not fit all, and seeking financial advice can help you find the right balance based on your financial goals.
Another common mistake is trading too much. Since each trade can rake up fees, this can impact your overall portfolio performance. A separate study showed that the most active traders saw the worst returns, underperforming the U.S. stock market by 6.5% on average annually.
Finally, it’s important to carefully monitor your investments regularly as market conditions change, factoring in fees and inflation. This will let you know if your investments are on track, or if you need to adjust based on changing personal circumstances or other factors.
Controlling What You Can
To help avoid these common investing mistakes, investors can remember to stay rational and focus on their long-term goals. Building a solid portfolio often involves assessing the following factors:
- Financial goals
- Current income
- Spending habits
- Market environment
- Expected returns
With these factors in mind, investors can avoid focusing on short-term market swings, and control what they can. Making small investments over the long run can have powerful effects, with the potential to accumulate significant wealth simply by investing consistently over time.

-

 Maps1 week ago
The Largest Earthquakes in the New York Area (1970-2024)
-

 Money2 weeks ago
Where Does One U.S. Tax Dollar Go?
-

 Misc2 weeks ago
Almost Every EV Stock is Down After Q1 2024
-

 AI2 weeks ago
The Stock Performance of U.S. Chipmakers So Far in 2024
-

 Markets2 weeks ago
Charted: Big Four Market Share by S&P 500 Audits
-

 Real Estate2 weeks ago
Ranked: The Most Valuable Housing Markets in America
-

 Money2 weeks ago
Which States Have the Highest Minimum Wage in America?
-

 AI2 weeks ago
Ranked: Semiconductor Companies by Industry Revenue Share