Mapped: Europe’s GDP Per Capita, by Country
The Growth of a $1,000 Equity Investment, by Stock Market
Mapped: The Most Valuable Company in Each Southeast Asian Country
Visualizing Global Inflation Forecasts (2024-2026)
The World’s Fastest Growing Emerging Markets (2024-2029 Forecast)
Countries With the Highest Rates of Crypto Ownership
Mapped: The Number of AI Startups By Country
All of the Grants Given by the U.S. CHIPS Act
Visualizing AI Patents by Country
How Tech Logos Have Evolved Over Time
Visualizing the Tax Burden of Every U.S. State
Charted: What Frustrates Americans About the Tax System
Ranked: The Top 20 Countries in Debt to China
Charted: Which Country Has the Most Billionaires in 2024?
Charted: Which City Has the Most Billionaires in 2024?
Life Expectancy by Region (1950-2050F)
What Causes Preventable Child Deaths?
The Cost of an EpiPen in Major Markets
Charted: Global Tobacco Use by Country and Sex
Visualized: What Lives in Your Gut Microbiome?
Who’s Building the Most Solar Energy?
Mapped: The Age of Energy Projects in Interconnection Queues, by State
Ranked: The Top 10 EV Battery Manufacturers in 2023
The World’s Biggest Nuclear Energy Producers
The World’s Biggest Oil Producers in 2023
Mapped: U.S. Immigrants by Region
Mapped: Southeast Asia’s GDP Per Capita, by Country
The Largest Earthquakes in the New York Area (1970-2024)
Mapped: Average Wages Across Europe
Mapped: Asia’s Population Patterns by Density
Where the World’s Aluminum is Smelted, by Country
Visualizing Global Gold Production in 2023
Gold vs. S&P 500: Which Has Grown More Over Five Years?
Charted: The Value Gap Between the Gold Price and Gold Miners
How People Get Around in America, Europe, and Asia
The Carbon Footprint of Major Travel Methods
Ranking the Top 15 Countries by Carbon Tax Revenue
Ranked: The Countries With the Most Air Pollution in 2023
Top Countries By Forest Growth Since 2001
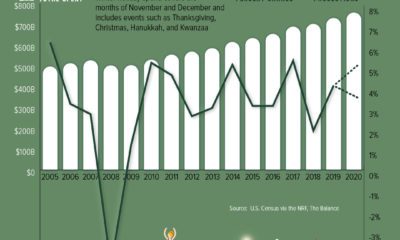
U.S. holiday spending is expected to reach an all-time high of up to $767 billion this holiday season. See how this compares to past years.
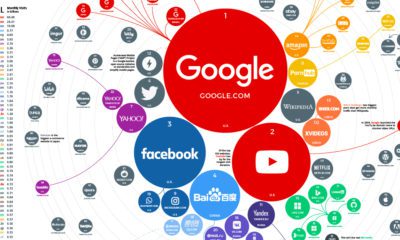
The top 100 websites ranking reveals how people around the world search for information, which services they use, and how they spend time online.
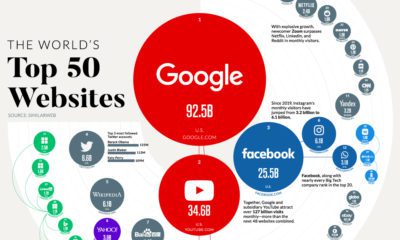
Just three websites get 152 billion visits monthly, outpacing the rest of the internet. Here, we rank the most visited websites worldwide.
This infographic examines trends in each generation's media consumption to see how Americans adapted during the pandemic.
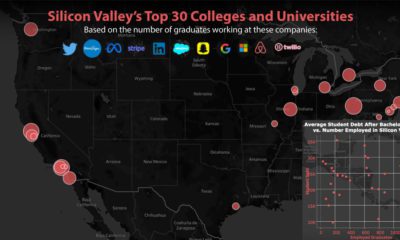
This graphic shows the top feeder schools to Silicon Valley, based on employee data from 12 different companies, including Twitter and Meta.
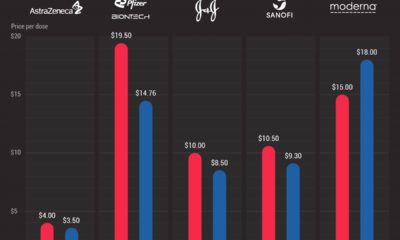
Compared to America, the EU has paid significantly less for a range of COVID-19 vaccines. Here's a look at vaccine prices in each region.
This giant infographic explores the biggest passenger ships on the open seas, over a period of almost 200 years.
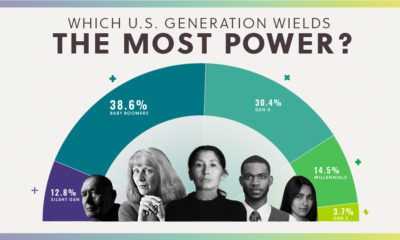
Using data from our new Generational Power Index, we look at how much economic, political, and cultural power each U.S. generation holds.
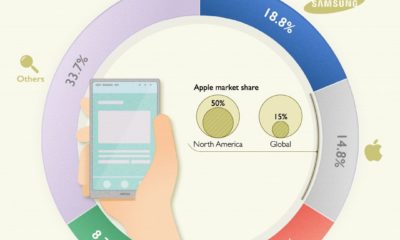
Worldwide smartphone sales decreased by 12% in 2020, but sales are expected to bounce back this year. Will Samsung remain the top dog?
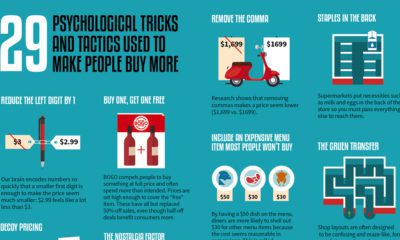
This graphic looks at 29 different psychological tricks that marketers use to try and influence consumer behavior.


 Creator Program