Sports
Football Fever: Investing in the Beautiful Game

Football Fever: Investing in the Beautiful Game
The very mention of football conjures up images of cheering fans from all corners of the world.
The global appeal of the game is undeniable, and it’s the strong support of fans that has propelled its growth into a multi-billion dollar industry.
Today’s infographic from Swissquote tracks how the sport has reached far and wide—even onto the stock exchange.
The Timeline of the Manchester United IPO
Manchester United is the largest publicly-traded football club in the world. The journey of its initial public offering (IPO) can be traced back almost 30 years.
- 1991: Man United floats on the London Stock Exchange (LSE)
It aims to raise £10 million, but falls short and finally raises £6.7 million. - 2003-2005: Malcolm Glazer acquires ownership of Man United
This raises the club’s market capitalization to £790 million, and it delists from the LSE. - 2012: Man United lists on the New York Stock Exchange
It aims to raise £62.8 million in this IPO, but surpasses this with a final raised value of £146.3 million. Interestingly, George Soros was the biggest investor in this deal, buying a nearly 2% stake in the club.
What makes a football team like Manchester United so attractive in the eyes of investors?
Over decades, a flourishing fan base from viewers to consumers has been the force behind the football industry’s success as a whole.
The Big Business of Football
FIFA, the international governing body of football, organizes and promotes all major tournaments. Its total revenue between 2015-2018 can be broken down into a few main components:
| Revenue Source | Amount | % of total |
|---|---|---|
| Broadcasting rights | €2,800 million | 48% |
| Marketing rights | €1,500 million | 27% |
| Accommodation and ticket sales | €600 million | 11% |
| Licensing rights | €500 million | 9% |
| Other revenue | €300 million | 5% |
| Total: €5,800 million |
In fact, 83% of this total revenue came from the 2018 Russia World Cup alone. This was viewed by approximately 3.6 billion people—nearly half the world’s population.
The World Cup’s revenue even rivals the combined strength of the top five European clubs. How do the five major clubs make their money?
| Club | Matchday | Broadcast | Commercial/ Sponsorships | 2019 Revenue |
|---|---|---|---|---|
| FC Barcelona | €159M | €298M | €384M | €841M |
| Real Madrid | €145M | €258M | €355M | €757M |
| Man Utd | €121M | €274M | €317M | €712M |
| Bayern Munich | €92M | €211M | €357M | €660M |
| Paris Saint-German | €116M | €157M | €363M | €636M |
| Total | €633M | €1.2B | €1.8B | €3.6B |
As viewership climbs, broadcasting rights furiously grow too—presenting numerous investment opportunities in sponsorship on the pitch and on the screen.
Cashing in on Clubs
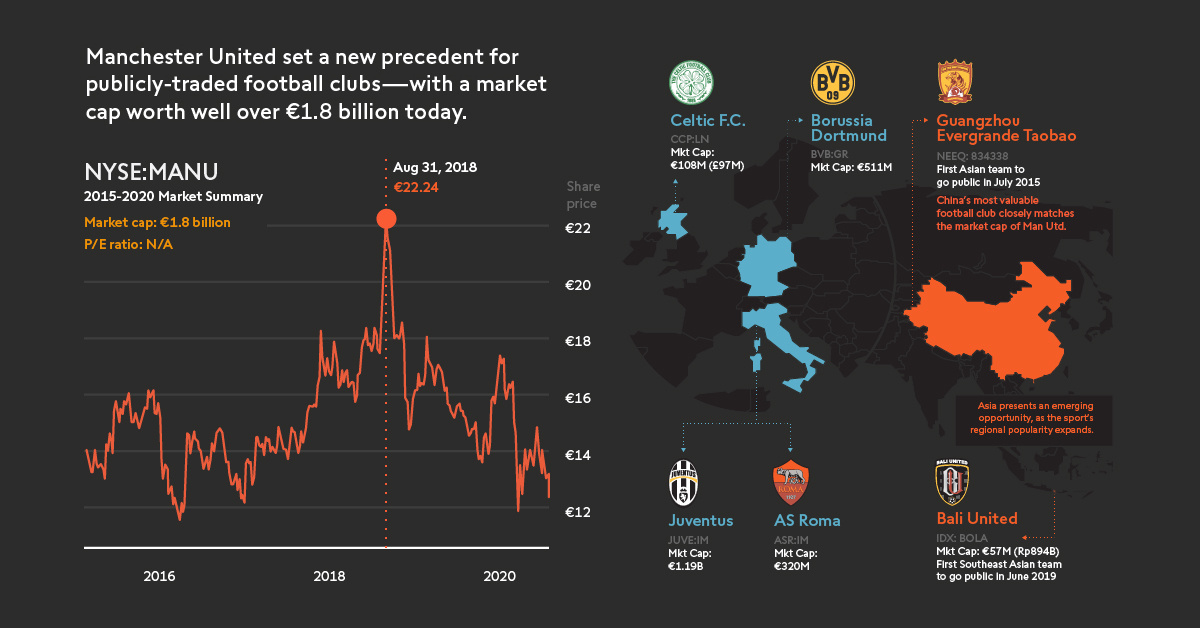
Manchester United (NYSE:MANU) set a new precedent for publicly-traded football clubs—with a market cap worth near €1.8 billion today.
Following Man United’s example, other major clubs have since gone public across Europe. As well, Asia presents an emerging opportunity as the sport’s regional popularity expands.
| Club | Stock Ticker | Mkt Cap (Jul 31, 2020) |
|---|---|---|
| 🇮🇹 Juventus FC S.p.A | JUVE:IM | €1.19B |
| 🇩🇪 Borussia Dortmund | BVB:GR | €511M |
| 🇮🇹 AS Roma | ASR:IM | €320M |
| 🇬🇧 Celtic F.C. | CCP:LN | €108M (£97M) |
| 🇨🇳 Guangzhou Evergrande Taobao | NEEQ:834338 | N/A |
| 🇮🇩 Bali United | IDX:BOLA | €57M (Rp894B) |
China’s most valuable football club—backed in part by e-commerce giant Alibaba—closely matches the valuation of Manchester United.
In Southeast Asia, Bali United was the first team to go public in June 2019. Shares jumped 69% higher than the initial listing price upon its IPO. This move is already propelling more planned IPOs for more football teams in the region, such as Persija Jakarta—the 2018 Liga 1 champion—and Thailand’s Buriram United.
The Future of Football
Football has the power to stir passions and unite people—and it’s reinventing itself constantly.
The 2019 Women’s World Cup was the most watched in tournament history, with over 1.12 billion tuning in. FIFA plans to invest almost €454 million more into the women’s game between 2019-2022, and grow the number of female players to 600 million by 2026.
Additionally, the annual esports tournament eWorld Cup is taking place in Thailand in 2020—tapping into the esports boom in Asia, which hosts 57% of esports enthusiasts.
Any football fan will tell you that the beautiful game is more than just a sport. And for investors, there are a variety of ways to gain exposure to this market—meaning fans can be both personally and financially invested as it continues to grow.


Sports
The Highest Earning Athletes in Seven Professional Sports
We illustrate how much the highest earning athletes across seven different sports make, and where they get their money from.
The Highest Earning Athletes in Seven Professional Sports
This was originally posted on our Voronoi app. Download the app for free on Apple or Android and discover incredible data-driven charts from a variety of trusted sources.
How much money do the world’s biggest athletes really make? And how do they compare across different sports?
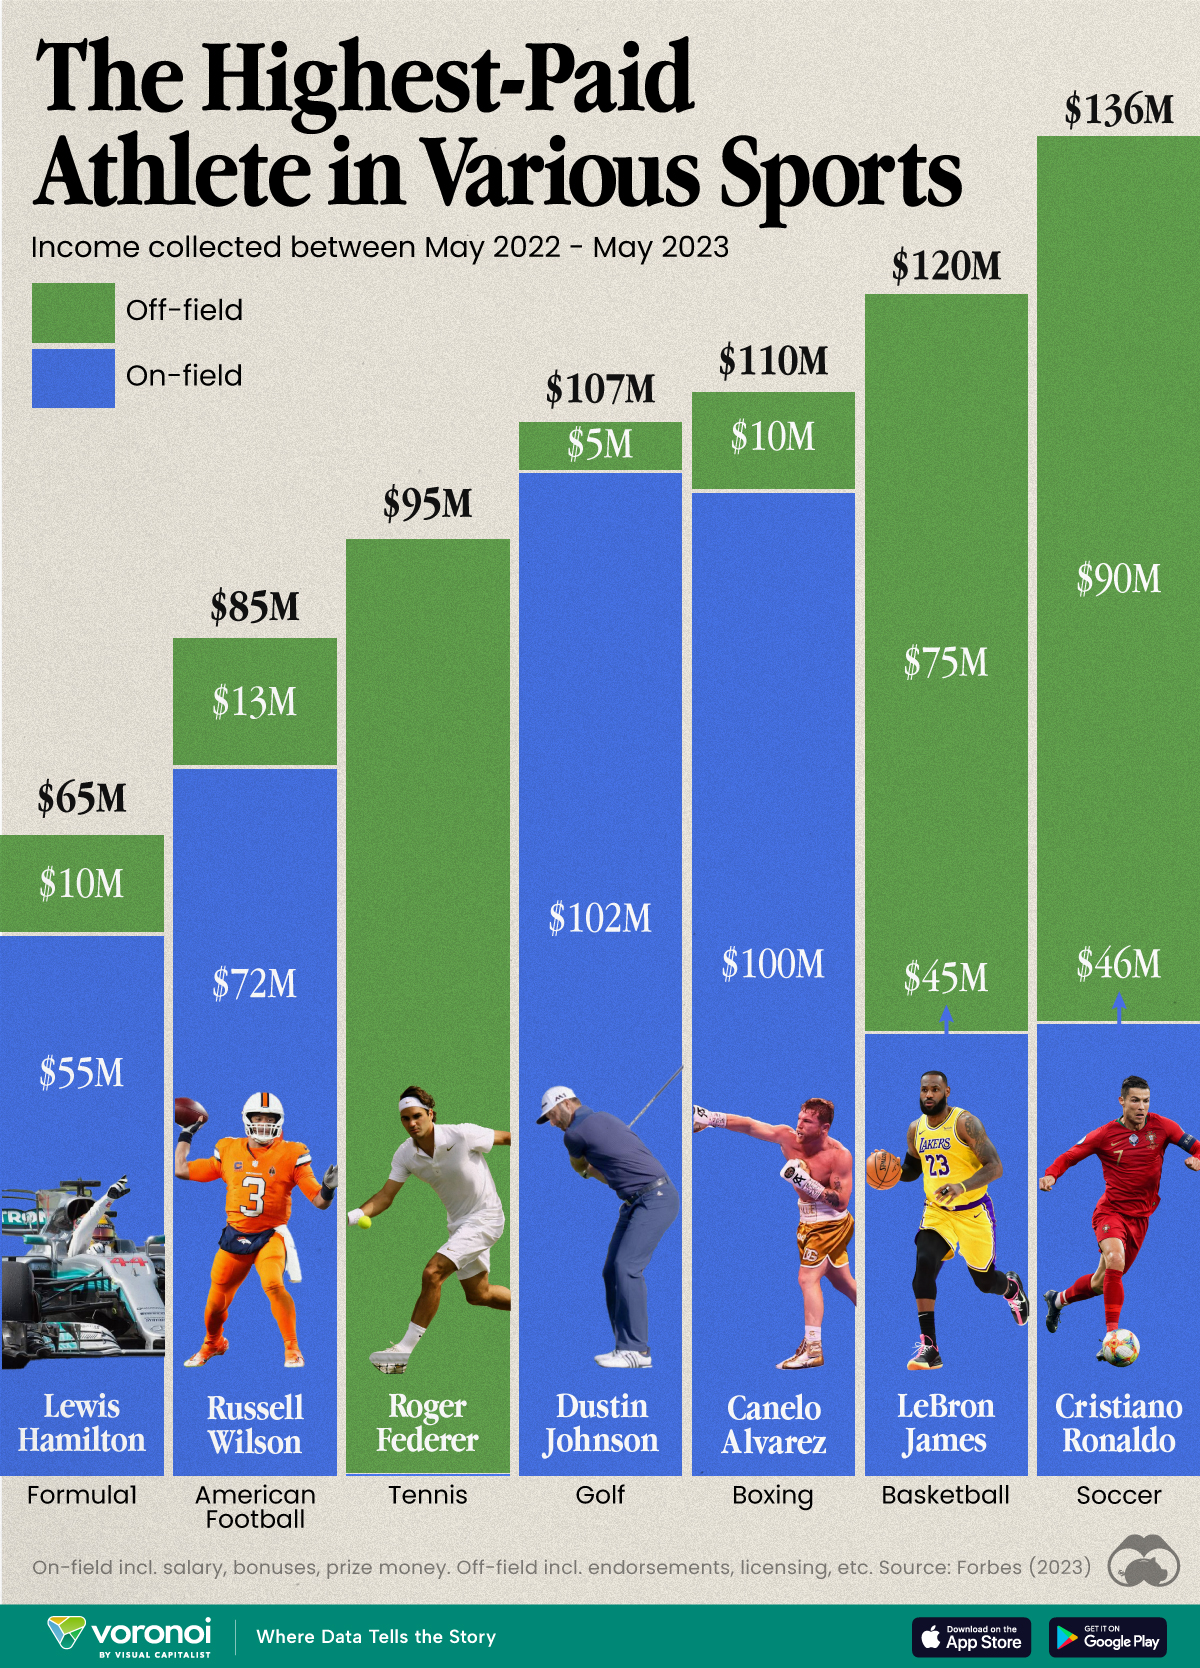
We visualized the highest earning athletes in various professional sports, according to calculations from Forbes. Earnings reported here cover the period of May 2022 to May 2023. Earnings includes on-field (salary, bonuses, prize money) and off-field (endorsements, licensing, etc).
Forbes’ research included talking to industry insiders, following news reports, and parsing salary databases. Please see their methodology page for further details.
Who is the Highest Paid Athlete in the World?
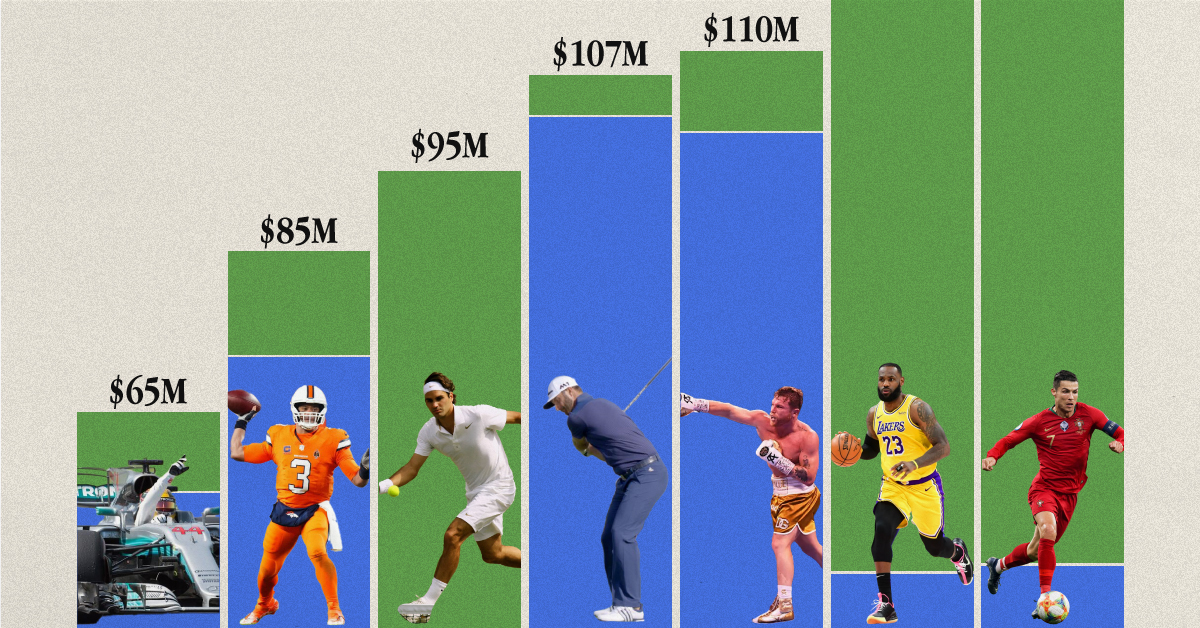
Cristiano Ronaldo was the highest-paid athlete in the world, making an estimated $136 million between May 2022 and May 2023. His move to Saudi Arabian club Al Nassr set a record for the biggest contract in the sport at the time.
Here’s how he compared to the top earners in some other sports.
| Athlete | Sport | Total Earnings (May 2022–23) |
|---|---|---|
| Cristiano Ronaldo | ⚽ Soccer | $136M |
| LeBron James | 🏀 Basketball | $120M |
| Canelo Alvarez | 🥊 Boxing | $110M |
| Dustin Johnson | ⛳ Golf | $107M |
| Roger Federer | 🎾 Tennis | $95M |
| Russell Wilson | 🏈 American Football | $85M |
| Lewis Hamilton | 🏎️ Formula 1 | $65M |
Note: Figures are rounded.
Los Angeles Lakers superstar LeBron James made the most money in basketball (just under $120 million), which is almost twice as much as Formula 1’s top earner, Lewis Hamilton, who took home about $65 million in 2022–23.
Something else to note is how off-court earnings can contribute significantly to total income for some athletes.
| Athlete | Sport | On-Field Earnings | Off-Field Earnings |
|---|---|---|---|
| Cristiano Ronaldo | ⚽ Soccer | $46M | $90M |
| LeBron James | 🏀 Basketball | $45M | $75M |
| Canelo Alvarez | 🥊 Boxing | $100M | $10M |
| Dustin Johnson | ⛳ Golf | $102M | $5M |
| Roger Federer | 🎾 Tennis | $0.1M | $95M |
| Russell Wilson | 🏈 American Football | $72M | $13M |
| Lewis Hamilton | 🏎️ Formula 1 | $55M | $10M |
Note: Figures are rounded.
This is most apparent with Roger Federer, who retired in 2022, after playing his last Laver Cup. However, his massive deals with Uniqlo, Rolex, and Mercedes, as well as his stake in running company On, still keeps him towards the top of the these lists.
Together with Ronaldo and James, these three athletes are widely considered the face of their sport, undoubtedly helping them secure lucrative endorsements and business deals.

-

 Money2 weeks ago
Which States Have the Highest Minimum Wage in America?
-

 Misc1 week ago
Airline Incidents: How Do Boeing and Airbus Compare?
-

 Environment1 week ago
Top Countries By Forest Growth Since 2001
-

 Economy2 weeks ago
Where U.S. Inflation Hit the Hardest in March 2024
-

 Demographics2 weeks ago
The Smallest Gender Wage Gaps in OECD Countries
-

 Markets2 weeks ago
The Top 10 States by Real GDP Growth in 2023
-

 Countries2 weeks ago
Population Projections: The World’s 6 Largest Countries in 2075
-

 Travel2 weeks ago
Ranked: The World’s Top Flight Routes, by Revenue