The Most Valuable Companies in Major EU Economies
Visualized: Interest Rate Forecasts for Advanced Economies
The Best U.S. Companies to Work for According to LinkedIn
The Top Private Equity Firms by Country
Economic Growth Forecasts for G7 and BRICS Countries in 2024
All of the Grants Given by the U.S. CHIPS Act
Visualizing AI Patents by Country
How Tech Logos Have Evolved Over Time
Ranked: Semiconductor Companies by Industry Revenue Share
The Stock Performance of U.S. Chipmakers So Far in 2024
Ranked: The Top 20 Countries in Debt to China
Charted: Which Country Has the Most Billionaires in 2024?
Charted: Which City Has the Most Billionaires in 2024?
Charted: Who Has Savings in This Economy?
How Debt-to-GDP Ratios Have Changed Since 2000
The Cost of an EpiPen in Major Markets
Charted: Global Tobacco Use by Country and Sex
Visualized: What Lives in Your Gut Microbiome?
Charted: Average Years Left to Live by Age
Charted: The Average Cost of Insulin By Country
Mapped: The Age of Energy Projects in Interconnection Queues, by State
Ranked: The Top 10 EV Battery Manufacturers in 2023
The World’s Biggest Nuclear Energy Producers
The World’s Biggest Oil Producers in 2023
How Much Does the U.S. Depend on Russian Uranium?
The Largest Earthquakes in the New York Area (1970-2024)
Mapped: Average Wages Across Europe
Mapped: Asia’s Population Patterns by Density
A Map of Global Happiness By Country in 2024
Mapped: Population Growth by Region (1900-2050F)
Visualizing Global Gold Production in 2023
Gold vs. S&P 500: Which Has Grown More Over Five Years?
Charted: The Value Gap Between the Gold Price and Gold Miners
Charted: Global Uranium Reserves, by Country
The Carbon Footprint of Major Travel Methods
Ranking the Top 15 Countries by Carbon Tax Revenue
Ranked: The Countries With the Most Air Pollution in 2023
Top Countries By Forest Growth Since 2001
Ranked: Top Countries by Total Forest Loss Since 2001
...spot Visual Capitalist? We’re right in between TechCrunch and The Guardian above. The colored borders represent a website’s logo or user interface. In terms of scale,...
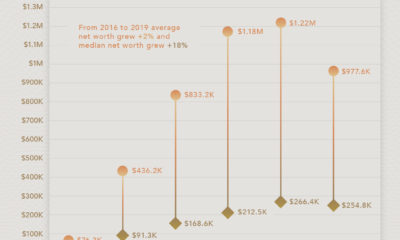
...median and mean (average) net worth in nearly every age category, suggesting that mean values are skewed upwards by outliers. Visualizing Net Worth by Age in...
...bi-monthly special features. “VC+ 2022 Wrap Up” BONUS GIFT: Recapping the Best Dispatches We Sent Out in 2022 This bonus gift recaps the very best special...
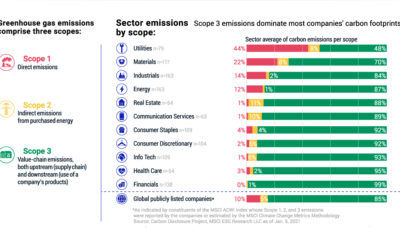
...rigorous, let alone feasible. To shine a light on this problem, MSCI developed a Net-Zero tracker that helps investors analyze the strength of company targets. What...
...49.0 Ad Dammam Saudi Arabia 48.5 Olomouc Czech Republic 48.2 Kosice Slovakia 48.2 Kuwait City Kuwait 48.0 San Jose Costa Rica 47.7 Coimbra Portugal 47.4 Abidjan...
...Google that is quantifying everything you do – pretty much every website is tracking you in some shape or form. Here’s what you need to know,...
The Advertising Revolution Sponsored by: Market One Media Group Many decades ago, the world was much simpler for advertisers. Buying a ½ page newspaper ad or...
...which has been prepared for incoming U.S. administrations since 1997. Publishing date: May 5 (Get VC+ to access) “Generational Power Index 2021: VC+ Bonus Material” SPECIAL...
...evolution of European map borders starting from 400 BC. Empires rise and fall, invasions sweep across the continent, and modern countries slowly begin to take shape...
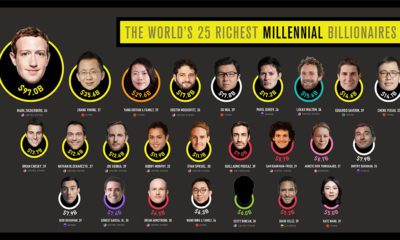
...between the years 1981 and 1996. This young generation represents around 3.8% of all billionaires on a global basis with a combined net worth of $573.1...


 Creator Program